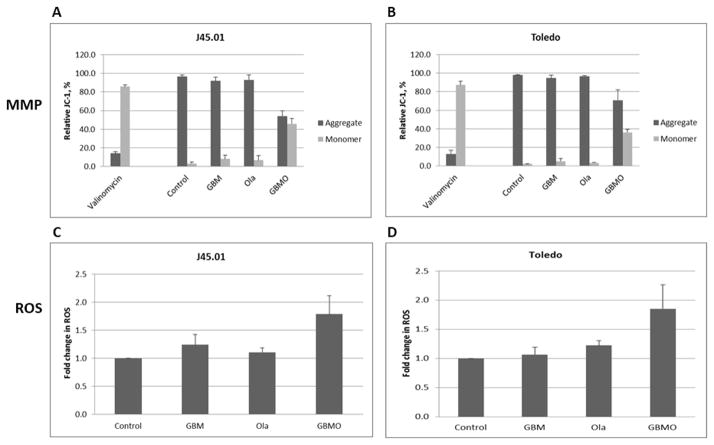
Figure 5.
Changes in the mitochondrial membrane potential (MMP) and level of reactive oxygen species (ROS). Cells were exposed for 48 hrs to drugs (alone or in combination) and analyzed for changes in MMP (A, B) and ROS (C, D) by flow cytometry as described under Methods. Abbreviations for drug names are the same as in Figure 1.

