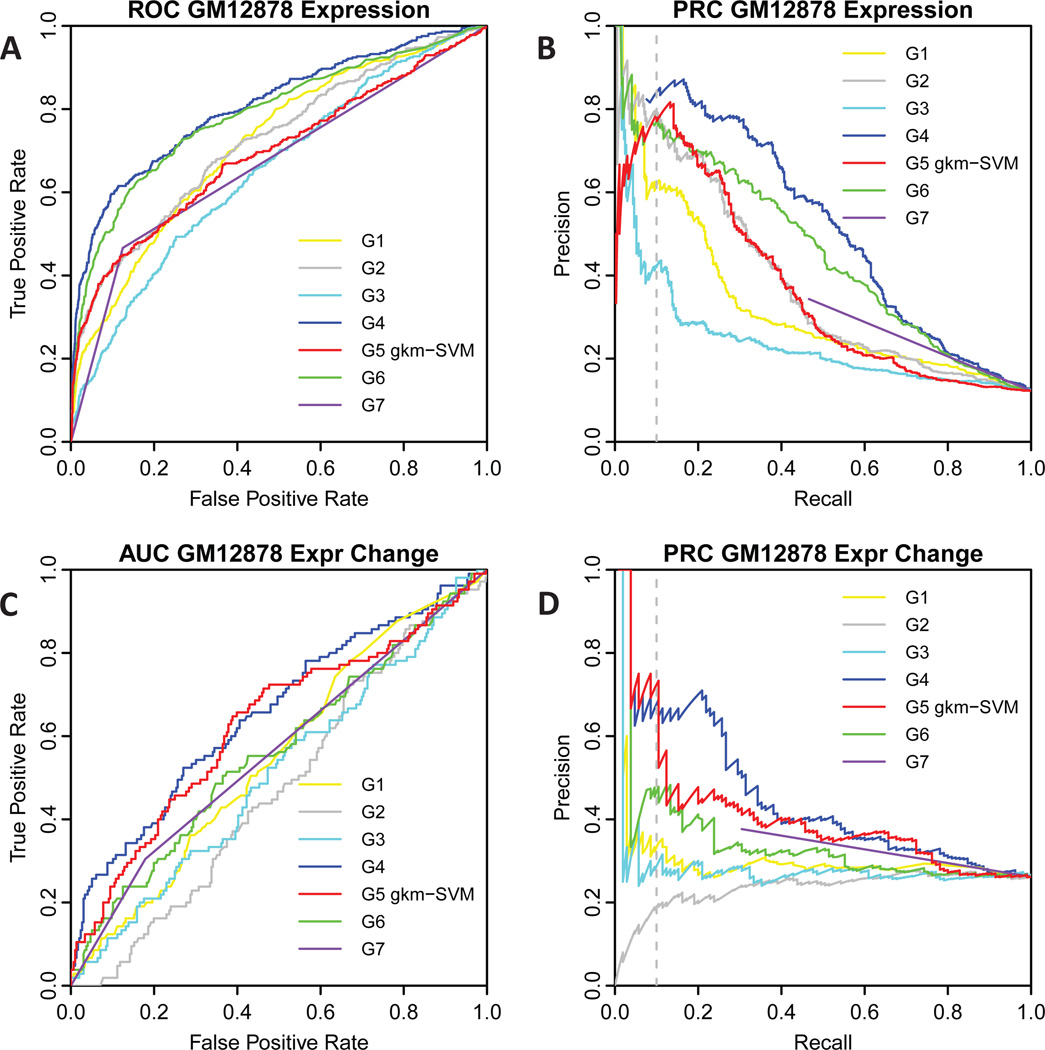
Fig. 1. Comparison of ROC and PRC curves for gkm-SVM and other prediction methods on the two eQTL challenges.
A) ROC curve for eQTL challenge part one, predicting expression in GM12878. B) PRC curve for eQTL challenge part one, predicting expression in GM12878. C) ROC curve for eQTL challenge part two, predicting expression change in GM12878. D) PRC curve for eQTL challenge part two, predicting expression change in GM12878. Group numbers are labelled as in the eQTL challenge overview paper (Kreimer et al., 2016), gkm-SVM is group 5 (G5). The gkm-SVM predictions are among the most accurate for predicting both expression and variant impact, even though they do not use the MPRA training data.

