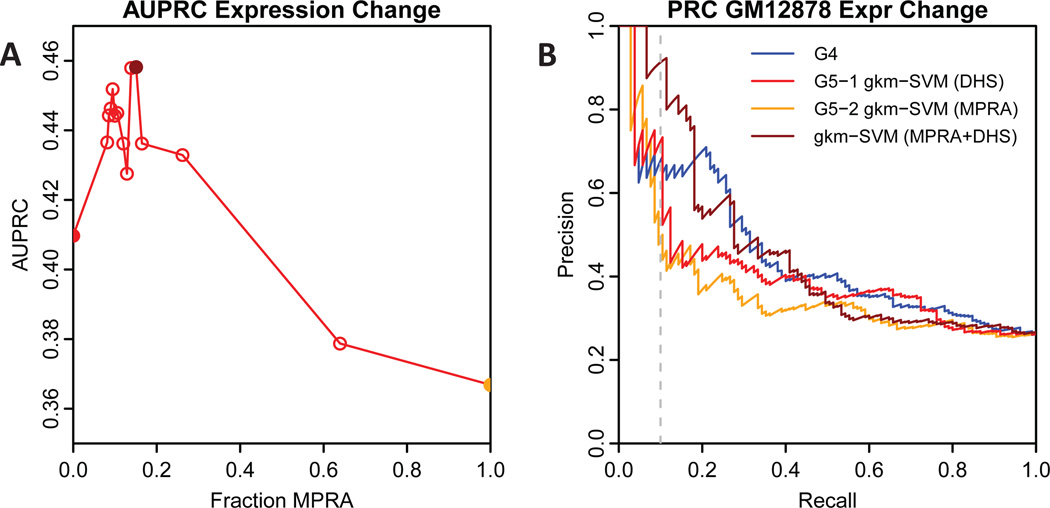
Fig. 2. AUPRC for gkm-SVM trained on combined MPRA and DHS data.
A) AUPRC for predicting expression change as the fraction of MPRA training data is varied from zero (method 5-1, red filled circle) to one (method 5-2, orange filled circle). Maximum AUPRC is achieved near 15% MPRA (dark red filled circle). B) PRC curve comparison for the top submitted method (4-1, blue), the two gkm-SVM submitted methods (red and orange), and gkm-SVM trained on 15% MPRA+DHS (dark red).

