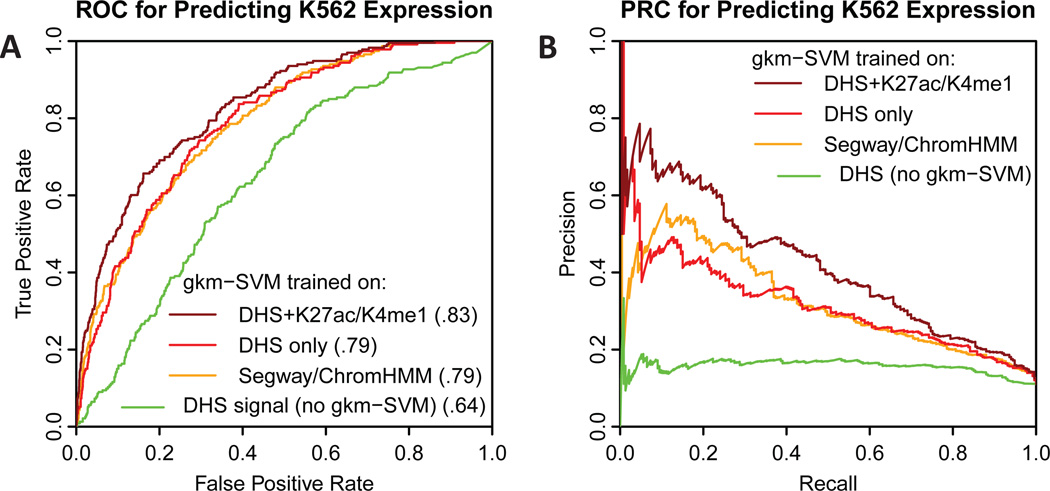
Fig. 3. Comparison of ROC and PRC curves for predicting MPRA expression in K562 cells.
A) ROC and B) PRC for predicting MPRA expression in K562 cells (Kwasnieski et al., 2014) using different methods. All tested regions were within Segway/ChromHMM enhancer predictions in K562, but only ~20% were positive. DHS in the tested regions is also weak predictor of expression (green). However a gkm-SVM trained on DHS regions or Segway/ChromHMM regions is reasonably accurate (red and orange). The most accurate predictor is a gkm-SVM trained on DHS regions flanked by H3K27Ac and H3K4me1 (dark red).

