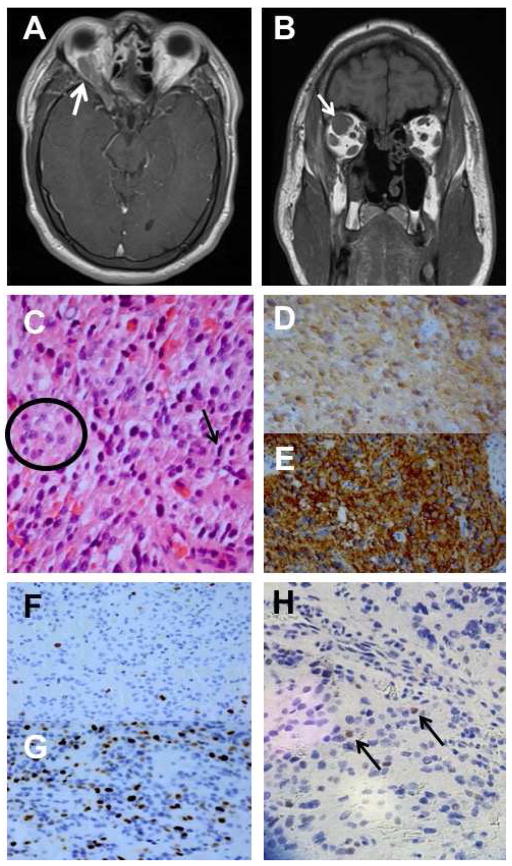
Figure 2.
A: MRI showing orbital extension of residual pituitary mass. B: MRI showing enlargement of superior rectus muscle suggesting orbital invasion by sellar mass. C: cells with pleomorphic nuclei with prominent nucleoli (circle) and occasional mitotic figures (arrow). D: positivity for neuron specific enolase. E: positivity for synaptophysin. F: Ki-67 proliferation index of 5–10% from 2011 biopsy. G: Ki-67 proliferation index of 25% from 2014 biopsy. H: p53 positivity in 5% of cells. (C: hematoxylin and eosin, 250X; D: anti-NSE, 25X; E: anti-synaptophysin, 25X; F and G: Ki-67 index, 25X; H: p53 reactivity, 25X).

