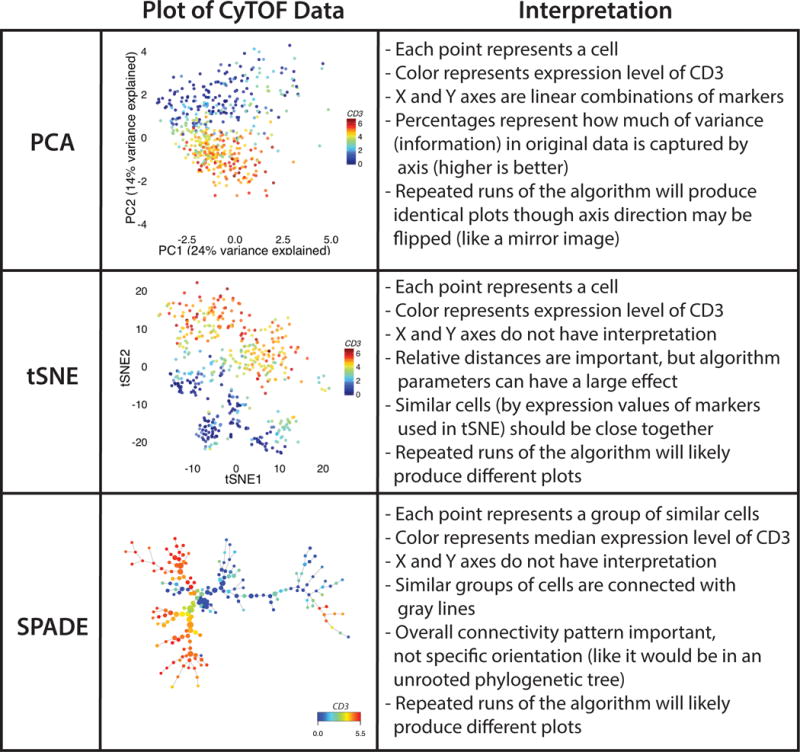
Figure 2. Mass cytometry (CyTOF) data on PBMCs from a pediatric liver transplant recipient [31] is depicted using three different algorithms: PCA, tSNE, and SPADE.

In each plot, the color corresponds to the level of CD3 on each cell (or group, in the case of SPADE). With PCA, one can see general separation of two different branches of the immune system. T cells are in the lower half of the plot and non-T cells are in the upper half. Replotting the same data using tSNE reveals a similar separation, but one can now see two groups of CD3+ cells in the upper half of the plot (which represent CD4 and CD8 T cells) and other groups of cells as well. Using SPADE similarly reveals the major branches of the immune system, including the separation of CD4 and CD8 T cells (the two branches on the left). PBMC, peripheral blood mononuclear cell; PCA, principal component analysis; SPADE, spanning tree progression analysis of density normalized events.
