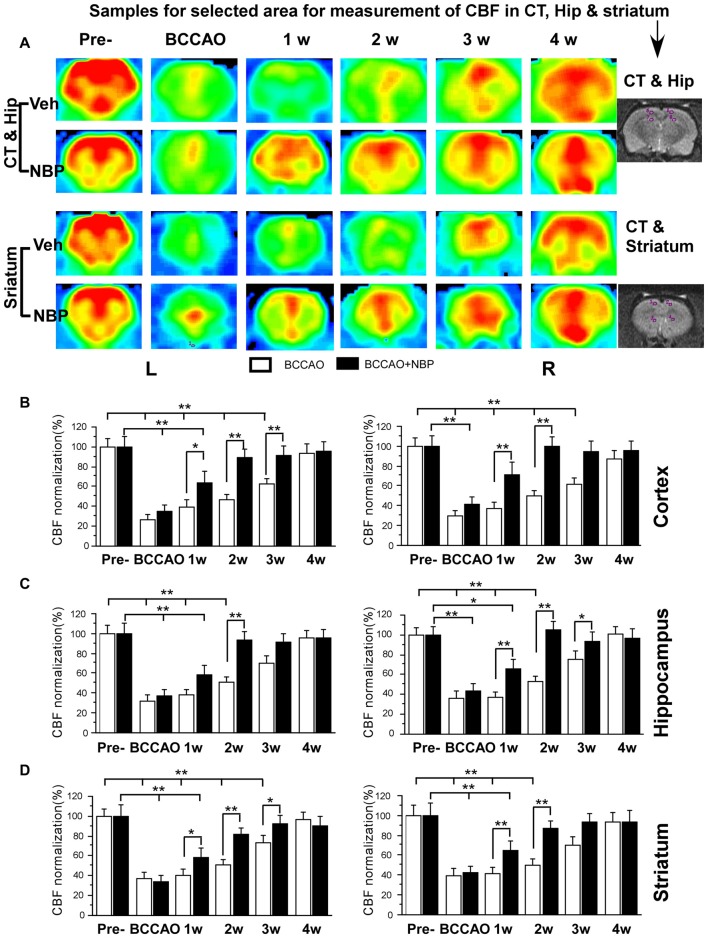
Figure 2.
Magnetic resonance imaging (MRI; 3D ASL) analysis showing changes in cerebral blood flow (CBF) in the vehicle and NBP-treated rat brains at different time points following bilateral common carotid artery occlusion (BCCAO). (A) CBF of the PC and hippocampus in the vehicle group is shown in the top row and the NBP-treated group in the second row. Likewise, CBF in the striatum with vehicle treatment is displayed in the third row, and the NBP-treated group is shown in the fourth row of images. The red color labeling represents increased CBF level, while green indicates lower CBF level. CBF quantitative analysis results in the cortex (B) hippocampus (C) and striatum (D) in the vehicle and BNP-treated groups at different time points after BCCAO. **p < 0.01; *p < 0.05. CT, cortex; Hip, hippocampus; Pre, pre-occlusion; BCCAO, bilateral common carotid artery occlusion; L, left; R, right.

