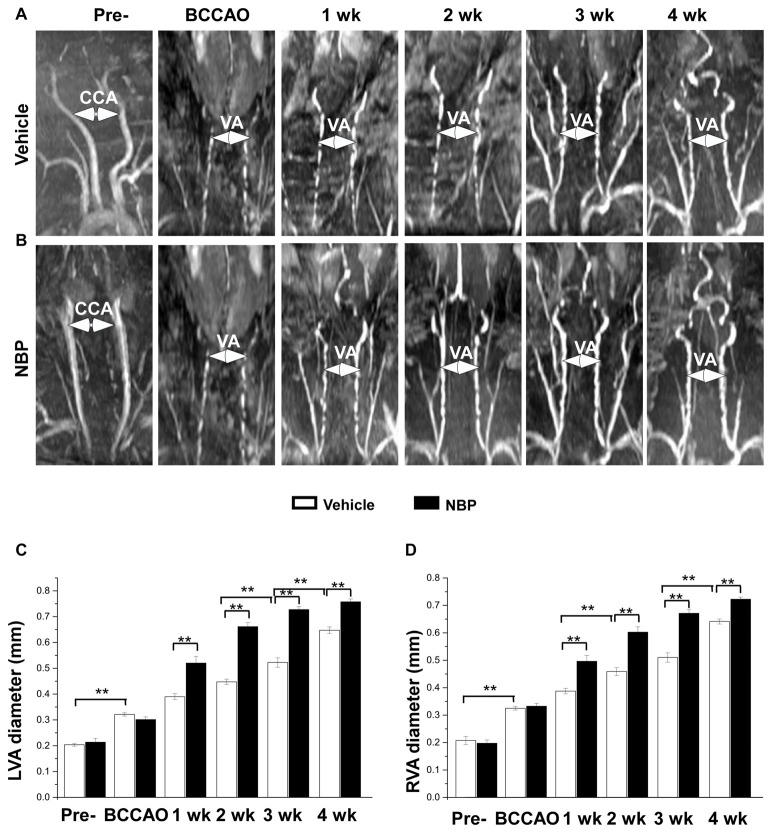
Figure 3.
MRI (3D-TOF) angiography showing morphological changes in diameter of vertebral arteries (VAs) in the vehicle and NBP-treated groups. Morphological changes in VAs are shown in the vehicle group (A) and NBP-treated group (B). Both CCAs were visible pre-occlusion but were not after BBCAO. However, the diameter of both VAs gradually increased until 4 weeks after BCCAO. VA diameter progressively increased after NBP treatment. (C,D) Quantitative analysis showing the changes of left (C) and right (D) VA diameter from 1 to 4 weeks in the NBP-treated group and the vehicle-treated group. **p < 0.01.

