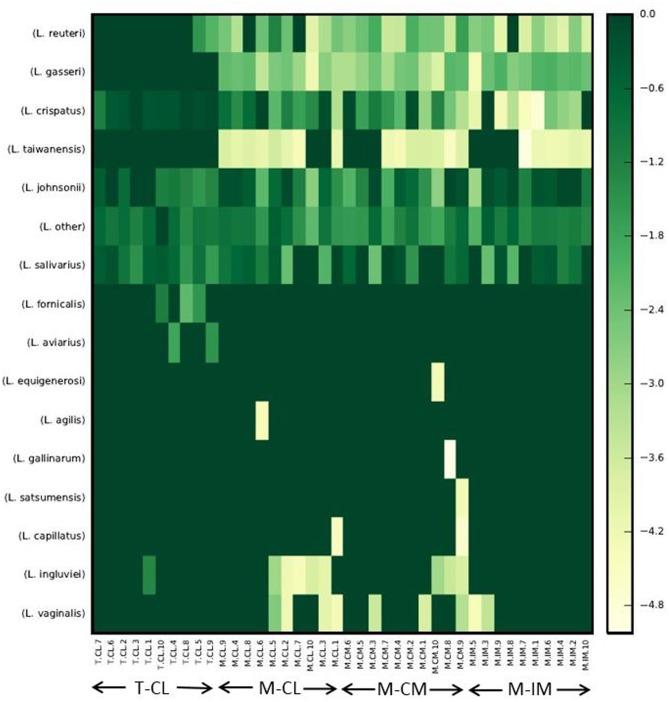
FIGURE 4.
Heatmap of normalized OTU table consisting of Lactobacillus species only. Heatmap was constructed with make_otu_heatmap.py option of QIIME with log transformation where all zeros were set to a small value (1/2 the smallest non-zero entry), and data was translated to non-negative after log transformation, and num_otu_hits was set to 0. The abundance of Lactobacillus species decreases as the intensity of color decreases from green to yellow. Total bacterial cells from cecal lumen (T-CL). MRS-recovered cells from cecal lumen (M-CL), cecal mucosa (M-CM), and ileal mucosa (M-IM).

