FIGURE 2.

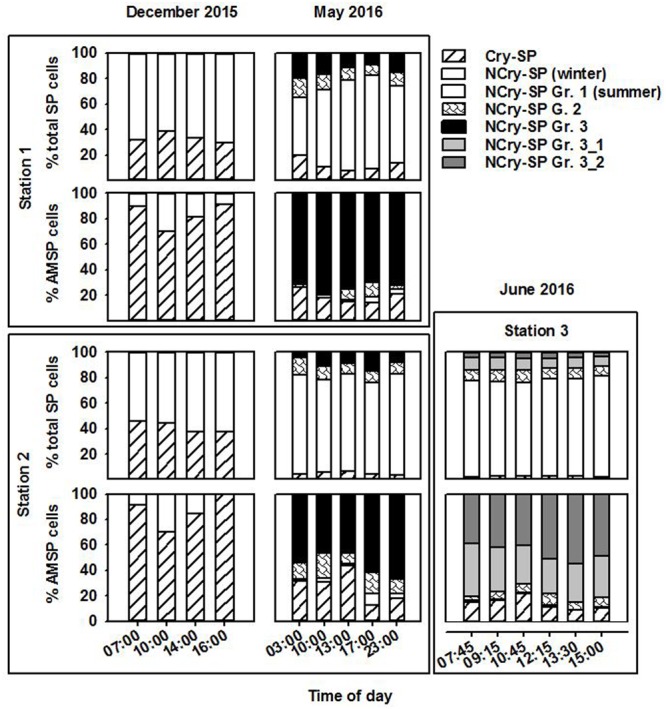
Relative contribution of the different groups (Gr.) distinguished on the flow cytometer to the total SP and AMSP pool at station 1, station 2, and station 3 in December 2015, May 2016, and June 2016.

Relative contribution of the different groups (Gr.) distinguished on the flow cytometer to the total SP and AMSP pool at station 1, station 2, and station 3 in December 2015, May 2016, and June 2016.