FIGURE 3.

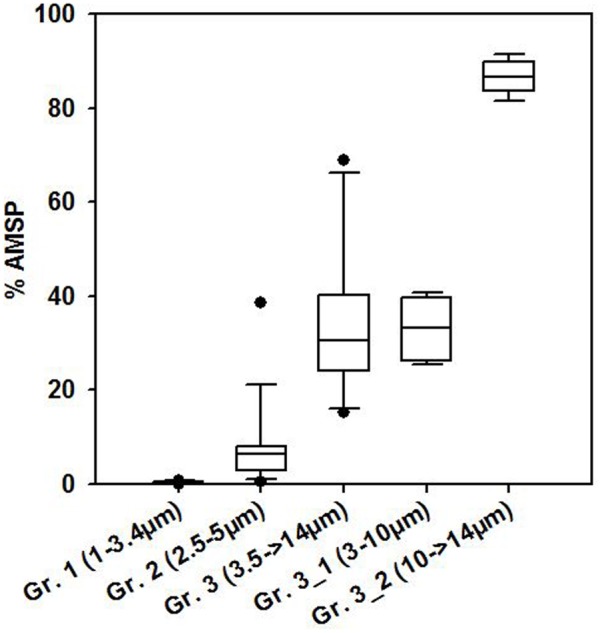
Boxplot showing average percentages of AMSP for the different NCry-SP groups (Gr.) distinguished on the flow cytometer in summer. The data was pooled for all time points sampled at all three study sites during both summer sampling dates.

Boxplot showing average percentages of AMSP for the different NCry-SP groups (Gr.) distinguished on the flow cytometer in summer. The data was pooled for all time points sampled at all three study sites during both summer sampling dates.