
FIGURE 4.
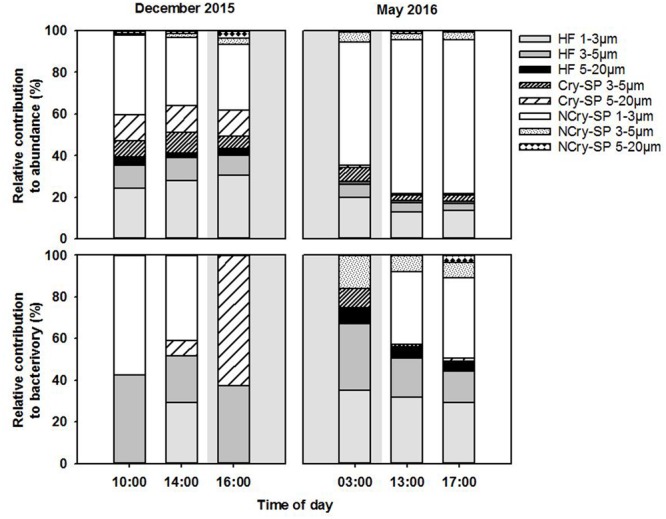
Relative contribution to total flagellate abundance and to total bacterivory rates of the different protist groups distinguished microscopically in December 2015 and May 2016. Shaded background areas indicate night-time sampling.
Official websites use .gov
A
.gov website belongs to an official
government organization in the United States.
Secure .gov websites use HTTPS
A lock (
) or https:// means you've safely
connected to the .gov website. Share sensitive
information only on official, secure websites.
Relative contribution to total flagellate abundance and to total bacterivory rates of the different protist groups distinguished microscopically in December 2015 and May 2016. Shaded background areas indicate night-time sampling.