Table 4.
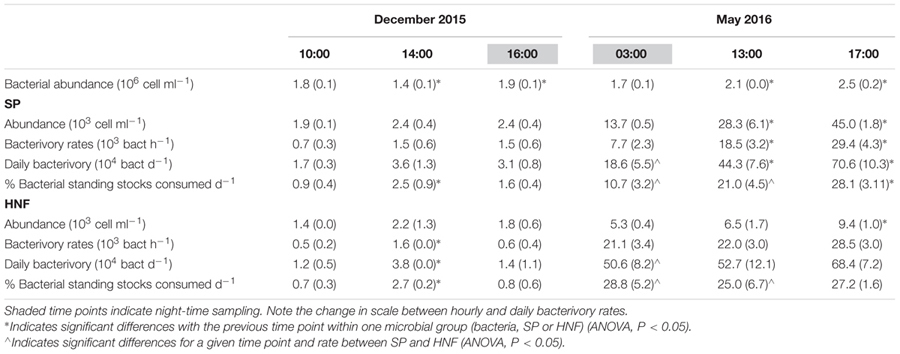
Average bacterial abundance and total HNF and SP abundance, measured hourly bacterivory rates and estimated daily bacterivory rates for December 2015 and May 2016 (standard deviation in parenthesis).
 |
Average bacterial abundance and total HNF and SP abundance, measured hourly bacterivory rates and estimated daily bacterivory rates for December 2015 and May 2016 (standard deviation in parenthesis).
 |