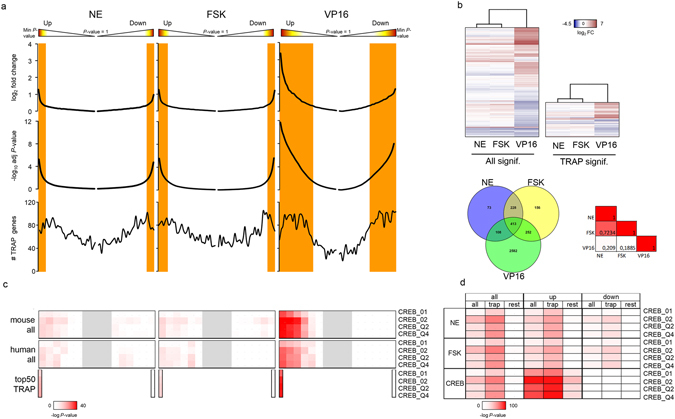
Figure 2.

Transcriptome profiles. (a) Gene distribution according to fold change, adjusted p-values, and direction of change (UP or DOWN). Orange shades are regions of significance (adjusted p-value < 0.05). TRAP genes are genes in the first quartile (Q1) of the TRAP list. Bins of 250 genes were used to calculate the median of fold change and p-value, and to count the number of TRAP genes in each bin. (b) Heatmaps, Venn diagrams and Pearson correlations of differentially expressed genes. Top, gene clustering according to log2FC by Euclidean distance in the initial transcriptome (ALL genes) and in the list of genes filtered by Q1-TRAP list of adult astrocyte genes. Bottom, Venn diagrams of differentially expressed genes and Pearson correlations. There are major transcriptome changes upon VP16-CREB over-expression as compared to stimulation with FSK or NE, and the latter groups are highly similar. The same patterns are observed in ALL and TRAP genes. (c) PSCAN analysis of CRE-enrichment probability in ‘all’ and Q1-TRAP-filtered genes using promoters of mouse and human orthologs. The probability of CRE occurrence is highlighted in a spectrum of reds. Gray shades are transcriptome regions not analyzed. Rows are different matrices containing variations of CRE motifs. CRE-containing genes are enriched in the UP portion in all lists. (d) PSCAN analysis comparing ‘all’, ‘Q1-TRAP’ and ‘rest’, or remaining genes. CRE-containing genes are enriched in Q1-TRAP genes as compared to ‘rest’ genes.
