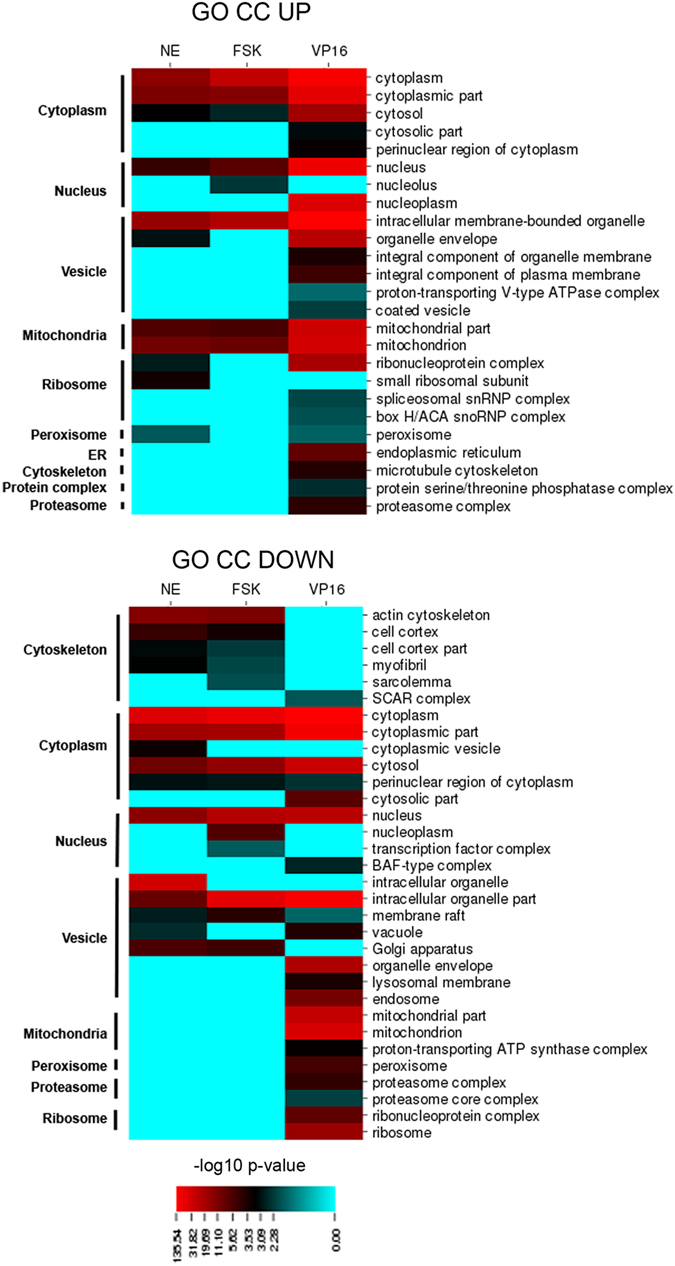
Figure 5.

Functional enrichment analysis with GO Cellular Compartment. Heatmaps show -log10 p-values for each enriched GO Cellular Compartment (CC) term (described in the right) in the pair-wise comparisons NE-CT; FSK-CT; VP16-Null. GOs were manually grouped into larger categories (left) for better understanding of functional changes among conditions. p-values correspond to an enrichment/depletion two-sided hypergeometric statistical test, corrected for multiple comparisons by Bonferroni post-hoc.
