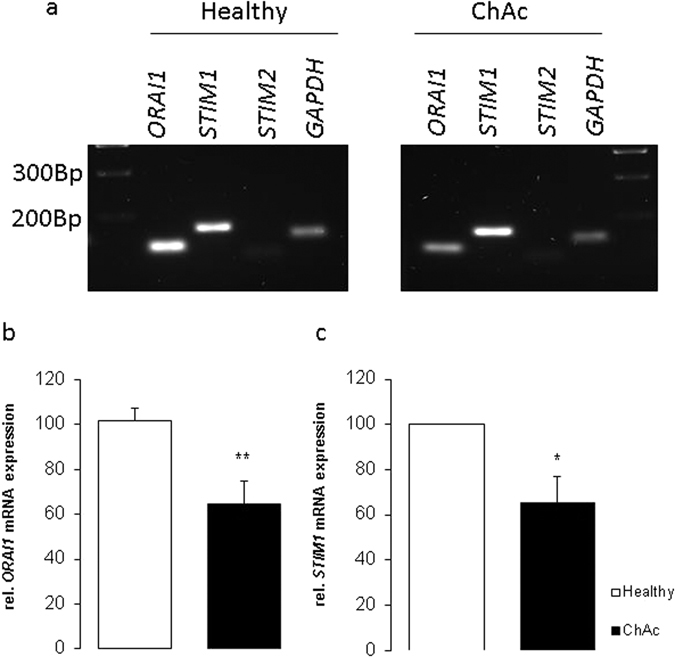
Figure 1.

ORAI1 and STIM1 transcript levels in neurons generated from ChAc patients and healthy volunteers. (a) Original gels illustrating specificity of PCR products. (b,c) Arithmetic means (±SEM, n = 4) of (b) ORAI1 and (c) STIM1 transcript levels in neurons isolated from healthy volunteers (white bars) or from ChAc patients (black bars). *(p < 0.05), **(p < 0.01) indicates statistically significant difference to respective value from healthy volunteers.
