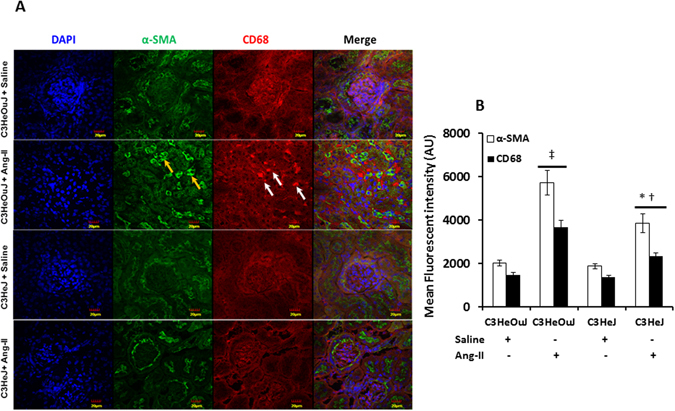
Figure 11.

The expression of α-SMA and CD68 is decreased in mice with TLR4 deficiency. (A) Representative immunofluorescence image for fibroblast marker, α-SMA and CD68, a marker for inflammatory macrophage. The α-SMA (yellow arrows) and CD68 (white arrows) expression is increased in tubulo-interstitial areas in mice with normal TLR4 to Ang-II treatment. (B) Data is presented as mean fluorescent intensity ± SEM. n = 5/group, tested by Kruskal-Wallis test and Mann-Whitney rank sum test. Magnification ×60. Scale bar: 20 µm. *p < 0.05 vs. C3HeJ + saline, †p < 0.05 vs. C3HeOuJ + Ang-II, ‡p < 0.05 vs. C3HeOuJ + saline. C3HeOuJ: normal TLR4, C3HeJ: TLR4 deficiency.
