Figure 2.

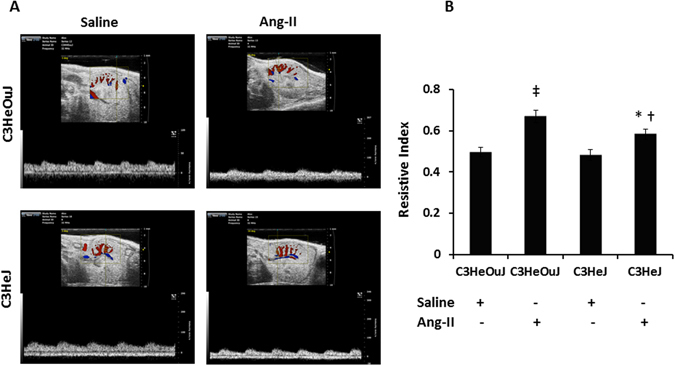
The resistive index of intrarenal cortical artery is decreased in TLR4 deficiency mice to Ang-II. (A) Representative images of left kidney in short axis. The transducer is fixed to obtain a window showing cortical vessels. The pulse wave cursor is then centered on a cortical artery with its axis in parallel and vascular signals are obtained. Resistive index is calculated by the formula (PSV-EDV)/PSV. PSV, peak systolic velocity; EDV, end diastolic velocity. (B) Bar graph shows mean resistive index ± SEM. n = 6/group tested by ANOVA and Student’s t-test. *p < 0.05 vs. C3HeJ + saline, †p < 0.05 vs. C3HeOuJ + Ang-II, ‡p < 0.05 vs. C3HeOuJ + saline. C3HeOuJ: normal TLR4, C3HeJ: TLR4 deficiency.
