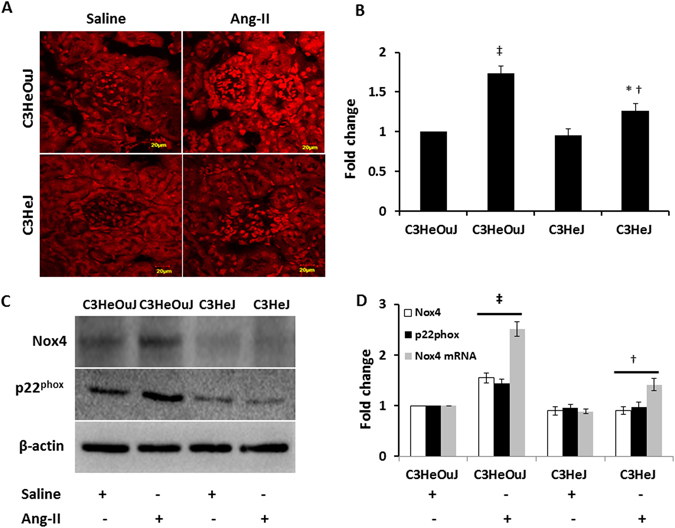
Figure 5.

TLR4 deficiency reduces Ang-II-induced oxidative fluorescence and Nox4 and p22PHOX expression. (A) Representative images of dihydroethidium (DHE) stained kidneys. Sections from mice with normal TLR4 exhibit intense DHE fluorescence suggesting increased oxidative stress. (B) Data shows fold change of mean intensity ± SEM. (C) Representative cropped immunoblot images of Nox4 and p22PHOX. Fifty micrograms of protein from each group were separated on SDS-PAGE and incubated with appropriate antibodies overnight. (D) mRNA fold change of Nox4 assessed by real-time PCR. Results are expressed as fold change relative to control mice (C3HeOuJ + Saline). Immunoblot data was normalized to β-actin. Values are presented as mean ± SEM. n = 6/group, tested by Kruskal-Wallis test and Mann-Whitney rank sum test. Scale bar: 20 µm. Magnification ×60. *p < 0.05 vs. C3HeJ + saline, †p < 0.05 vs. C3HeOuJ + Ang-II, ‡p < 0.05 vs. C3HeOuJ + saline. C3HeOuJ: normal TLR4, C3HeJ: TLR4 deficiency.
