Figure 7.

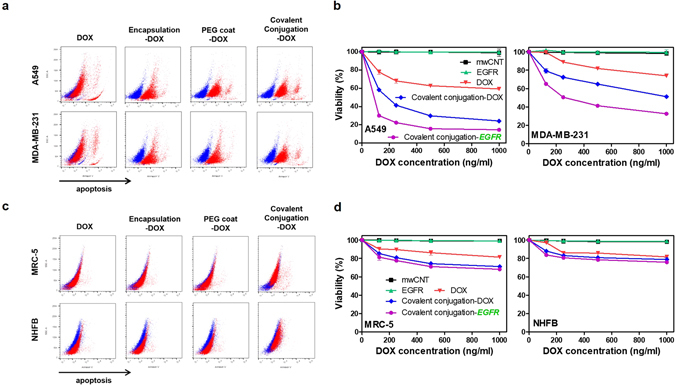
Differential cell apoptosis and cytotoxicity on cancer and normal cells by various types of nanodrugs. (a) Blue and red markers correspond to control and drug-treated cells, respectively. A549 and MDA-MB-231 cells were stained with annexin V-Pacific blue. After 24 hrs of treatment with various types of nanodrugs, samples were analyzed by FACS. Encapsulation-DOX, PEG coat-DOX and covalent conjugation-DOX (red) showed significant apoptosis compared to controls (blue) (i.e., untreated cells). (b) MTT results of cancer cells (A549 and MDA-MB-231) by treatment of EGFR conjugated nanodrug. The addition of anti-EGFR conjugation (purple, covalent conjugation-EGFR) maximized the cytotoxicity compared with non-anti-EGFR nanodrugs (blue, covalent conjugation-DOX). (c) MRC-5 cells and NHFB showed statistically negligible differences in apoptosis for the various types of nanodrugs compared to controls (blue) (i.e., untreated cells). (d) MTT results of normal cells (MRC-5 and NHFB) by treatment of EGFR conjugated nanodrug. The addition of anti-EGFR conjugation (purple, covalent conjugation-EGFR) maximized the cytotoxicity compared with non-anti-EGFR nanodrugs (blue, covalent conjugation-DOX). All MTT data represent the mean ± SEM (n = 5).
