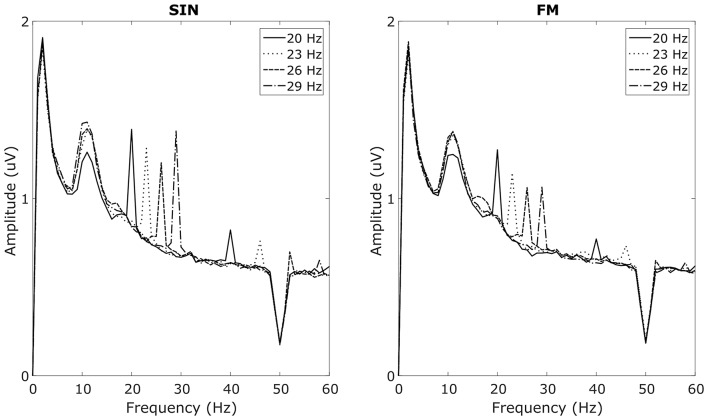
Figure 3.
Average SSVEP spectra. Averaged over subjects with visible SSVEP peaks in the target frequencies and averaged over O1 and O2. Left plot shows responses to sinusoidal (SIN) stimulation, right plot shows responses to FM stimulation. Line styles corresponds to the four stimulation frequencies. For each style, two peaks at the corresponding stimulation frequency as well as at its first harmonic can be seen. The broad peak around 10 Hz reflects spontaneous alpha oscillations.

