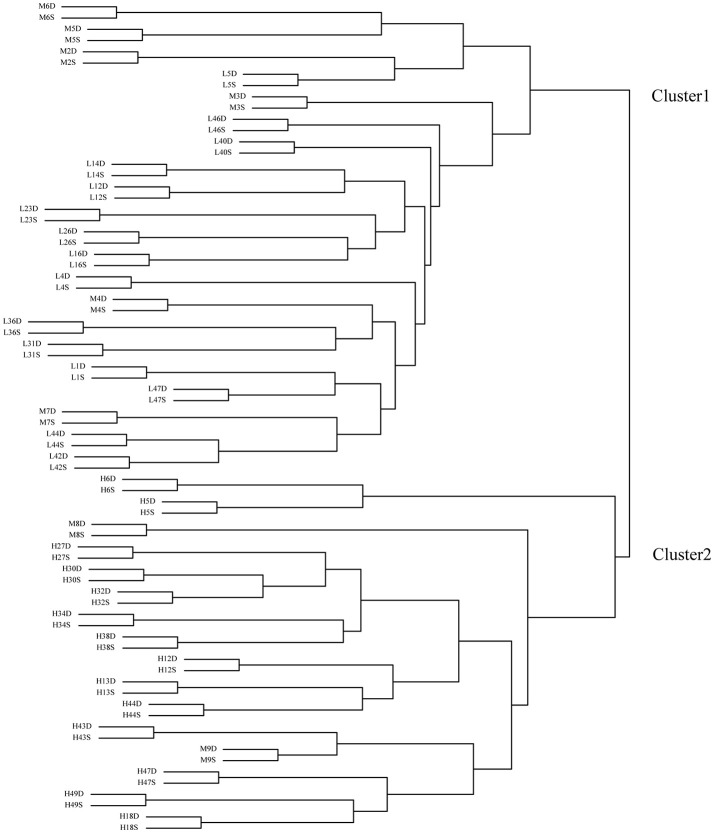
Figure 2.
Clustering of the 74 samples by transcriptome data. H is the deep rooting rice varieties, L is the shallow rooting rice varieties, and M is the median rooting rice varieties. S indicates the shallow roots sample (the roots defined by an angle of 50° from the horizontal, centered on the stem of the rice plant), D indicates the deep roots sample (the roots defined by an angle of 40° from the vertical, centered on the stem of the rice plant).

