Figure 3.
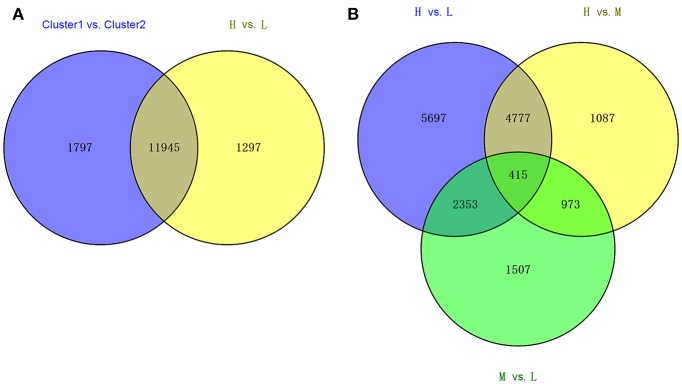
The Venn diagram of the different collections of DEGs. (A) The overlaps of DEGS from Cluster1 vs. Cluster2 and the DEGs from H vs. L. (B) The overlaps of DEGs from three groups' comparison: H vs. L, H vs. M, and M vs. L. Cluster1 and Cluster2 was classified by clustering analysis referred to the Figure 2. H is the deep rooting rice varieties, L is the shallow rooting rice varieties, and M is the median rooting rice varieties.

