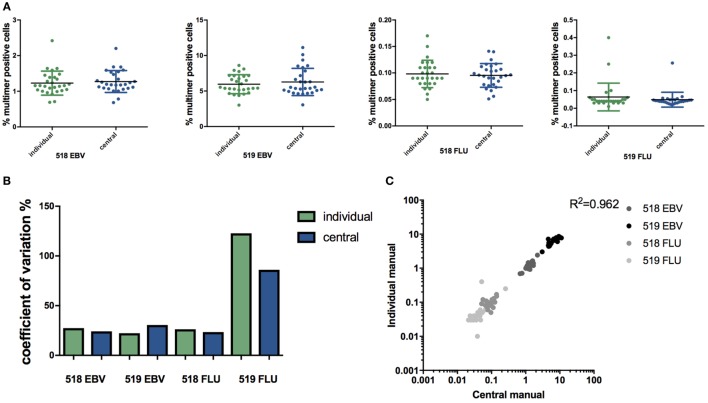
Figure 1.
Individual versus central manual gating. (A) Percentage of multimer positive cells (EBV or FLU) in total CD8+ T cells in two healthy donors (518 and 519) identified through individual or central manual gating. Each dot represents the mean value for duplicate experiments for an individual lab, n = 28. Line indicates mean and error bars indicate SD. No significant difference between individual gating and central gating was detected (paired t-test). (B) The coefficient of variation (CV = SD/mean*100) related to the identification of major histocompatibility complex multimer positive T cell populations either through individual gating (green) or central manual gating (blue) for the two virus responses and two donors. No differences are statistically significant (asymptotic CV equality test). (C) Correlation of the percentage of multimer positive cells found with individual and manual gating. p < 0.0001 (Pearson correlation), n = 112. Mean values from duplicate experiments are shown. Different colors represent different populations. Individual: gating is done by each individual lab. Central: gating on all files is performed by the same person. 519: healthy donor 519; 518: healthy donor 518; EBV: Epstein–Barr virus; FLU: influenza virus.

