
Figure 3.
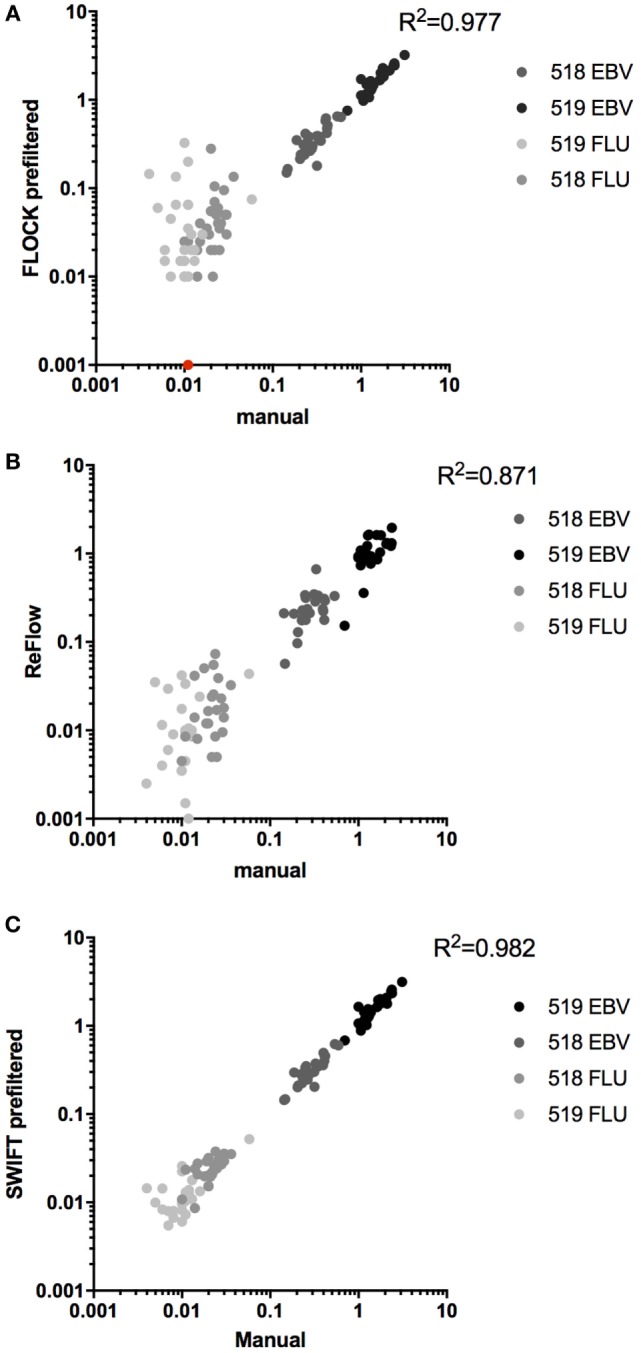
Automated analyses versus central manual gating. Correlation between automated analyses and central manual gating for the identification of MHC multimer positive T cell populations, using either of the three algorithms: (A) FLOCK, n = 112, p < 0.0001, one data point of 0% was converted to fit the log axis (given in red); (B) ReFlow, n = 92, p < 0.0001; (C) SWIFT, n = 108, p < 0.0001. All p-values are Pearson’s correlations. Different colors indicate different populations.