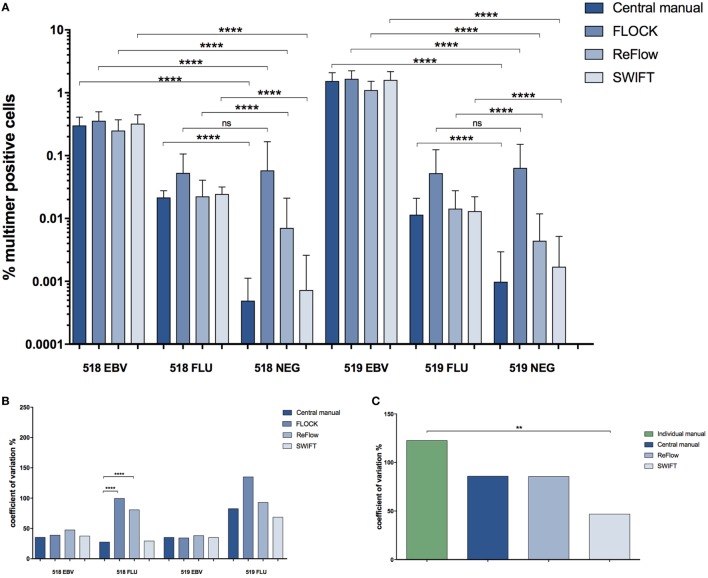
Figure 4.
Comparison of the different analysis methods. (A) Percentage of MHC multimer+ T cells out of single, live lymphocytes found using the different analysis approaches for identification of T cells recognizing two different virus-derived epitopes (EBV, FLU) in two different donors (518, 519). Error bars indicate SD. ****: p < 0.0001; ns: not significant (paired t-test). Central manual: n = 28, FLOCK: n = 28, ReFlow: n = 23, SWIFT: n = 27. (B) The coefficient of variation (CV) (SD/mean*100) for the different analysis approaches in determining the frequency of MHC multimer+ T cells. ****: p < 0.0001; no line: no significant difference (asymptotic CV equality test). (C) The CV (SD/mean*100) specifically related to the FLU-specific response in donor 519. **: p < 0.01; no line: no significant difference (asymptotic CV equality test). For (C), the CV is calculated based on percentage of MHC multimer+ T cells out of total CD8 T cells in order to compare with individual manual gating. 518: healthy donor 518; 519: healthy donor 519; EBV: Epstein–Barr virus; FLU: influenza virus.

