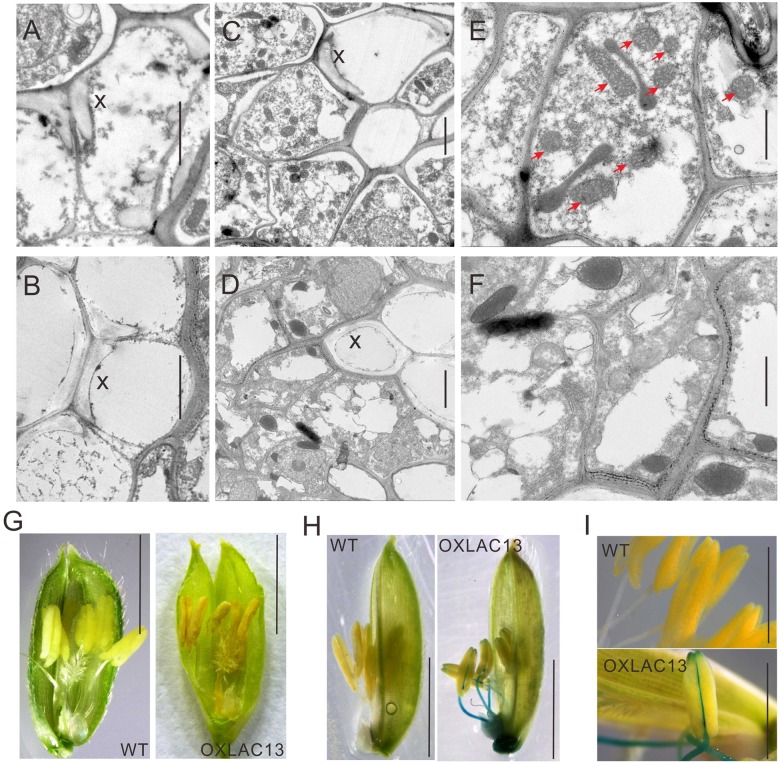
FIGURE 3.
Transmission electron micrographs of vascular and ROS accumulation in WT and OXLAC13 anthers. (A,B) The secondary xylem of WT (A) and OXLAC13 (B) anther vascular. Scale bars, 2 μm. (C,D) The phloem of WT (C) and OXLAC13 (D) anther vascular. Scale bars, 2 μm. (E,F) Magnified image of the phloem of WT (E) and OXLAC13 (F). The red arrows show the normal mitochondria in WT phloem (E). Scale bars, 1 μm. X, secondary xylem. (G) Flowers of WT and OXLAC13 plants at the mature stage, showing that the OXLAC13 flowers turn brown at this stage. Scale bars, 4 mm. (H) TMB staining of H2O2 production at the late anther development stage showing blue color. Scale bars, 4 mm. (I) A higher-magnification image of the anthers at the late anther development stage after TMB staining. Scale bars, 2 mm.

