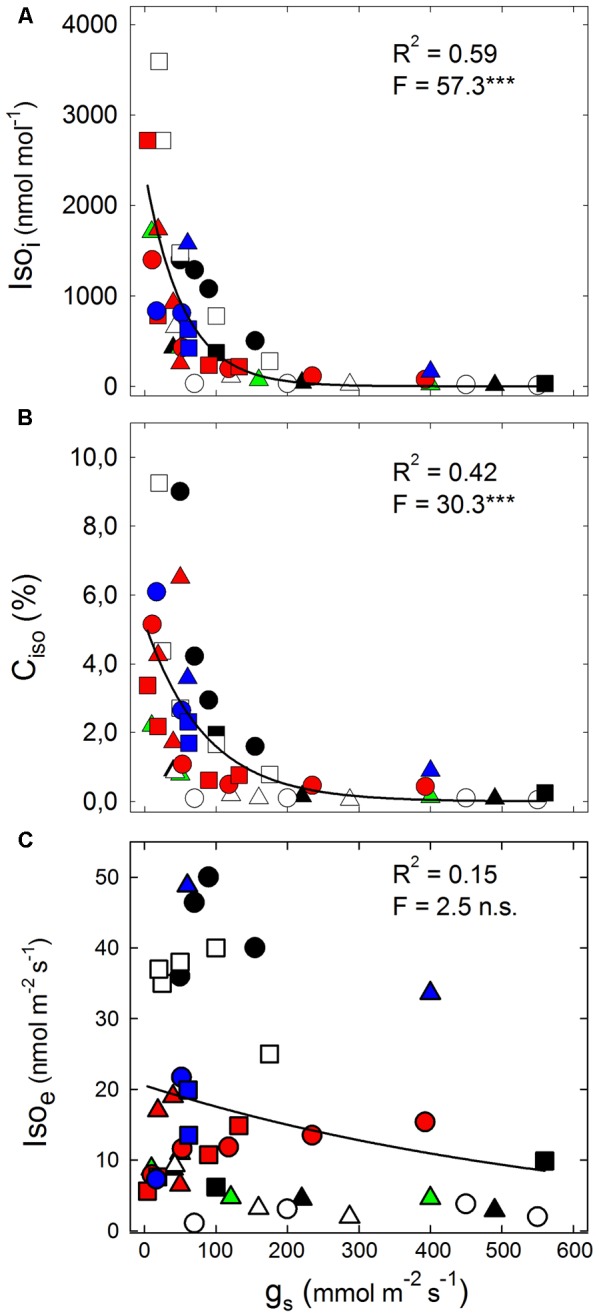
FIGURE 1.

The relationship between (A) internal isoprene concentration (Isoi); (B) percent of fresh assimilated carbon lost as isoprene emission (Ciso); (C) isoprene emission (Isoe) and stomatal conductance (gs). Isoprene concentration was calculated using a simplified version of the equation proposed by Singsaas et al. (1997), as Isoi = 2.83 × Isoe/gs, where the factor 2.83 is the ratio of the diffusion coefficient of water vapor through air to that of isoprene through air; Ciso = 5 × (Isoe, μmol m-2 s-1)/(AN, μmol m-2 s-1) × 100. Non-linear correlations have been drawn using the following exponential decay curve, Isox = a -b ×χ. Data points derive from the experimental data reported in: Brilli et al. (2007) (Populus alba:
 ); Brilli et al. (2013) (Eucalyptus citriodora:
  ); Funk et al. (2004) (P. deltoides:
 ); Tani et al. (2011) (Quercus serrata:
 ); Tattini et al. (2014) (Nicotiana tabacum: ○); Tattini et al. (2015) (Platanus × acerifolia: ●); Velikova et al. (2016) (Arundo donax: ▄); Pegoraro et al. (2004) (Q. virginiana:
 ); Dani et al. (2014) (▴, E. occidentalis and E. camaldulensis:
 ); Staudt et al. (2016) (Q. pubescens:
 ); Marino et al. (2017) (P. nigra: □); Brunetti et al., personal communication, (Moringa oleifera: Δ).
