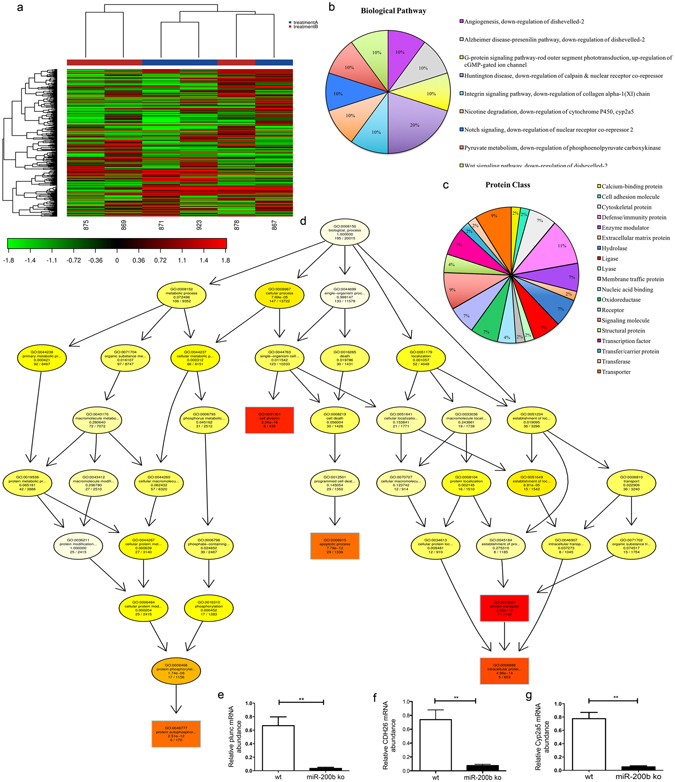
Figure 4.

Next Generation Sequencing and Gene ontology (GO) showed the most affected pathways in the lungs of miR-200b−/− mice. (a) The heat map diagram shows the results of a two-way hierarchical clustering of RNA transcripts and samples. It includes the 500 genes that have the largest coefficient of variation based on FPKM counts. Each row represents one gene and each column represents one sample. The color represents the relative expression level of a transcript across all samples. The color scale is shown below: red represents an expression level above the mean; green represents an expression level below the mean. (wt samples: 867, 871 and 923; miR-200b ko samples: 875, 878 and 869). (b,c) Pie charts for transcript gene functional analysis conducted for Biological Pathway and Protein class using the PANTHER gene ontology database. (d) GO network generated from the GO terms predicted to be enriched for the Biological process (BP vocabulary). Nodes are colored from red to yellow with the node with the strongest support colored red and nodes with no significant enrichment colored yellow. The five nodes with strongest support are marked with rectangular nodes. (e,f,g) Q-PCR confirmed significantly lower Plunc, Cdh26 and Cyp2a5 mRNA levels in miR-200−/− (ko) lungs than miR-200+/+(wt).
