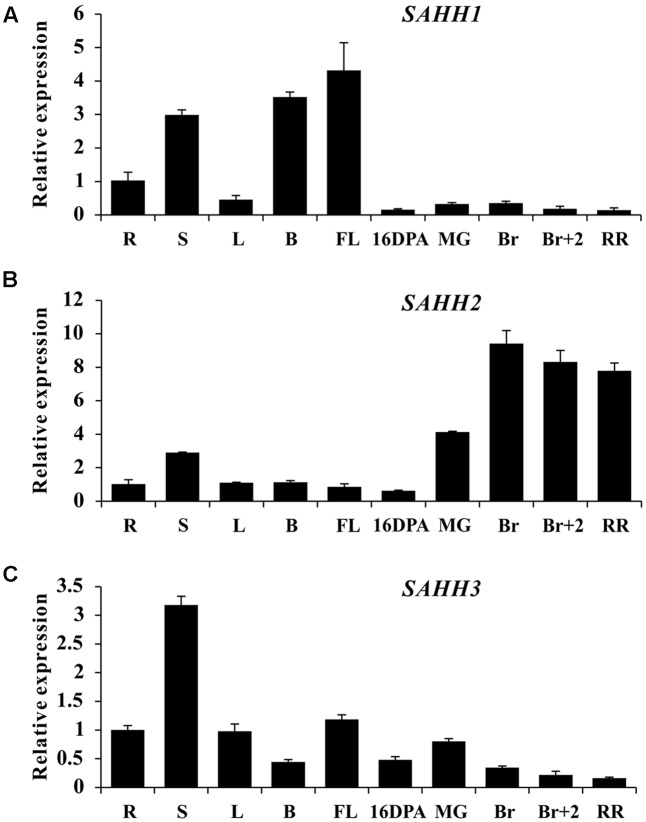
FIGURE 1.
Expression patterns of SlSAHH genes in wild-type tomato (WT). (A) Tissue profile analysis of SlSAHH1 in different tissues in WT. (B) Tissue profile analysis of SlSAHH2 in different tissues in WT. (C) Tissue profile analysis of SlSAHH3 in different tissues in WT. R, Roots; S, stems; L, leaves; B, floral buds, FL, anthesis flowers; 16 DPA, 16 days post anthesis; MG, mature green fruit; Br, color breaker fruit; Br+2, 2 days post breaker fruit; RR, red ripe fruit. The quantitative PCR data represent mean values for three independent biological replicates (n = 3).

