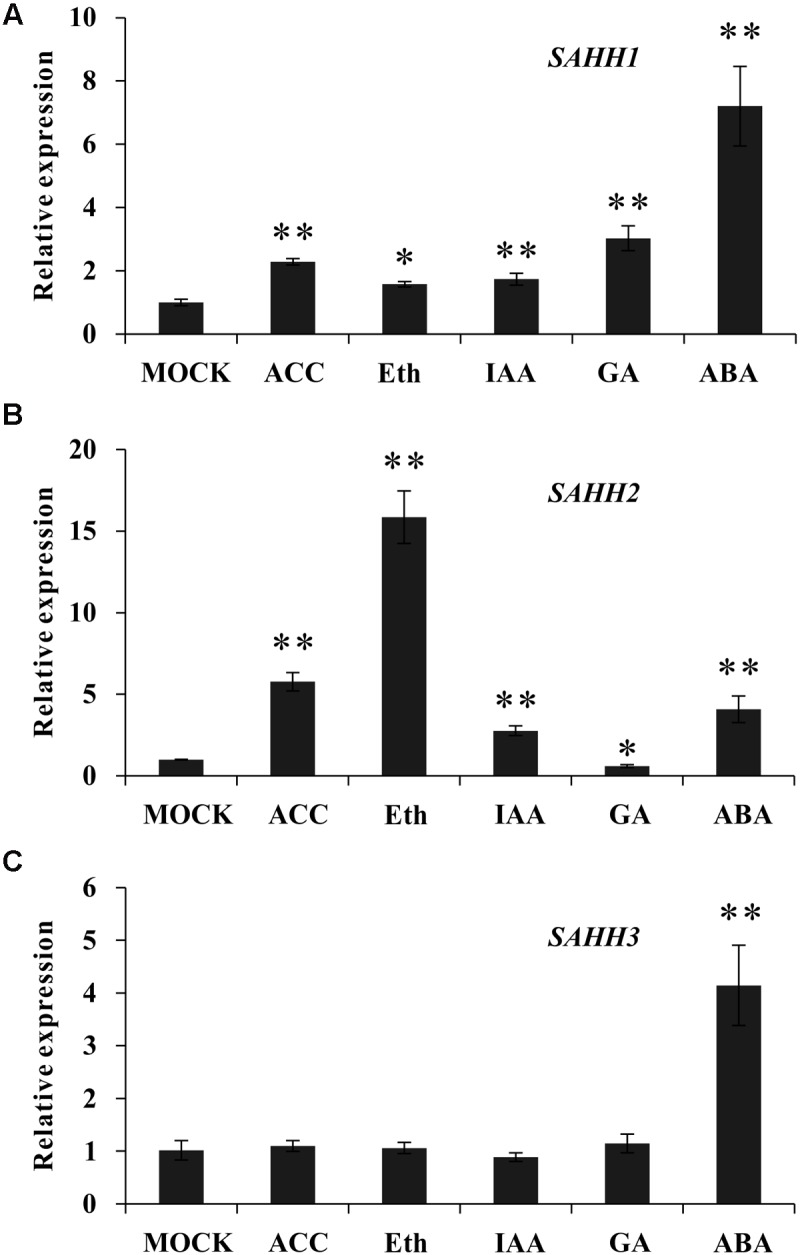
FIGURE 2.

The response of SlSAHH gene family members to different types of ripening related hormones after treatment for 96 h. (A) The expression of SlSAHH1 responded to phytohormones. (B) The expression of SlSAHH2 responded to phytohormones. (C) The expression of SlSAHH3 responded to phytohormones. Mock, solution (pH 5.6) contained 10 mM MES and sorbitol (3% w/v); ACC, 1-aminocyclopropane-1-carboxylic acid; Eth, ethephon; IAA, indole-3-acetic acid; ABA, abscisic acid. The quantitative PCR data represent mean values for three independent biological replicates (n = 3). As determined by t-test, ∗ and ∗∗ indicate significant differences between mock and hormone treated group with P < 0.05 and P < 0.01, respectively.
