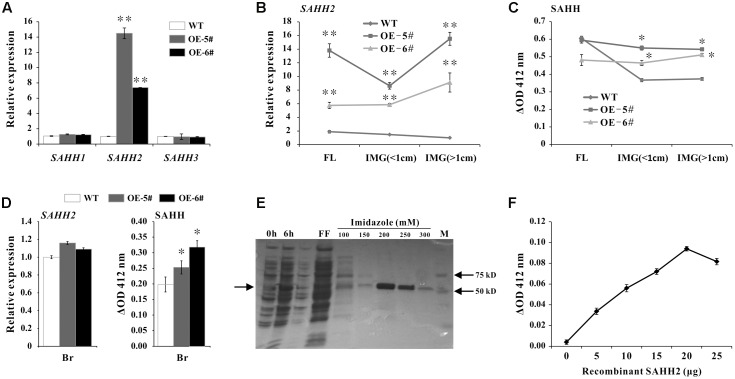
FIGURE 3.
Over expression of SAHH2 enhanced SAHH enzymatic activity. (A) The mRNA levels of SlSAHH1, SlSAHH2 and SlSAHH3 in leaves of WT and transgenic lines. WT, wild-type; OE-5# and OE-6#, two independent SlSAHH2 over-expression (OE) lines. (B) The mRNA level of SlSAHH2 in FL and IMG fruit of WT and transgenic lines. FL, flowers; IMG (<1 cm), immature fruit (diameter less than 1 cm); IMG (>1 cm), immature fruit (diameter more than 1 cm). (C) SAHH enzymatic activity analysis in FL and IMG fruit of WT and transgenic lines. (D) The mRNA level of SlSAHH2 and corresponding SAHH enzymatic activity in WT and transgenic breaker fruit. (E) Recombinant expression and purification of SlSAHH2. 0 h, sample collected without IPTG induction; 6 h, sample collected 6 h after IPTG induction; FF, flow-through fraction; 100, 150, 200, 250, 300 refer to different concentration of imidazole (mM) used for elution. (F) Enzyme activity detection with the gradually increased dose of recombinant protein SAHH2. The quantitative PCR data represent mean values for three independent biological replicates (n = 3). ∗∗Refers to significant differences between transgenic lines and WT with P < 0.01, as determined by t-test. The SAHH enzymatic activity assays were performed in three repetitions with six replicates each. ∗Refers to significant differences between transgenic lines and WT with P < 0.05, as determined by t-test.

