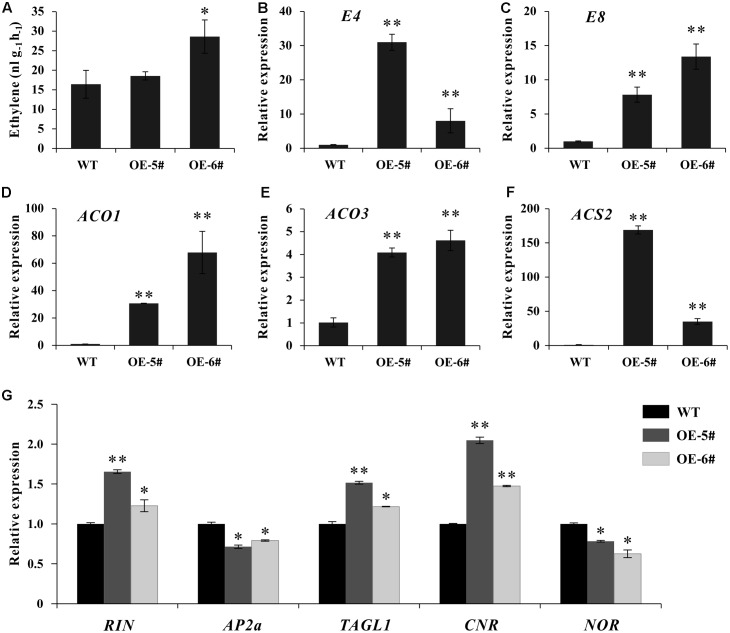
FIGURE 5.
Analysis of ethylene production and expression of ethylene related genes in OE-5#, OE-6# and WT fruit at breaker stage (Br). (A) Production of ethylene in WT and OE fruit. Fresh breaker fruit were sealed in air-tight vials, and 1 mL of gas was sampled from the headspace after 16 h. Values represent means from 10 individual fruits. Error bars represent SE. (B) Expression of E4 in OE lines and WT in breaker fruit. (C) Expression of E8 in OE lines and WT in breaker fruit. (D) Expression of ACO1 in OE lines and WT in breaker fruit. (E) Expression of ACO3 in OE lines and WT in breaker fruit. (F) Expression of ACS2 in OE lines and WT in breaker fruit. (G) Expression of RIN, AP2a, TAGL1, CNR and NOR in OE lines and WT in breaker fruit. For qPCR analysis, the data represent mean values for three independent biological replicates. ∗ and ∗∗ indicate significant differences between transgenic lines and WT with P < 0.05 and P < 0.01, respectively, as determined by t-test.

