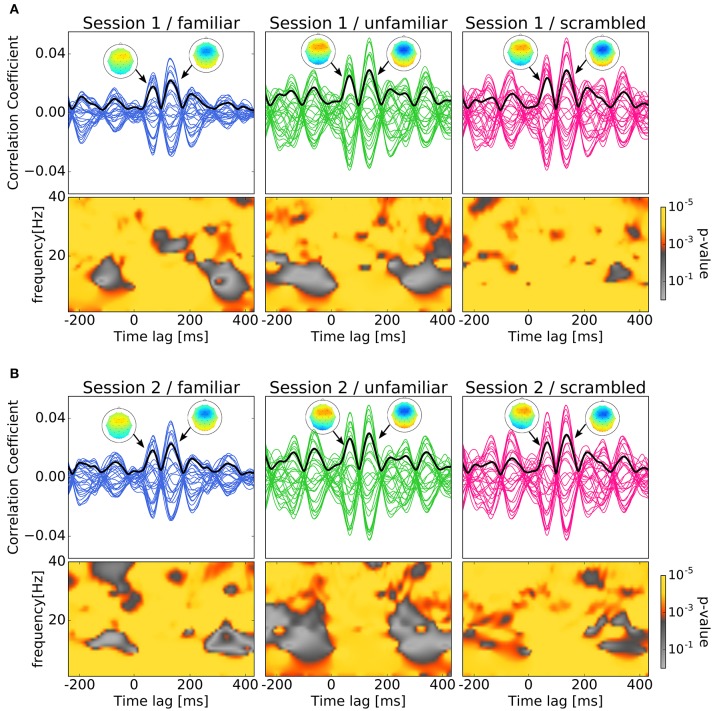
Figure 4.
Results of cross-correlation and significance values in the time-frequency plane. In both (A,B), top panels show Cross-correlation values between the envelope of sound stimuli and EEG averaged across trials and subjects for the session and category. Each line indicates the cross-correlation curve for one channel. The black solid line presents the standard deviation of the cross-correlation values across channels. Each sub-figure shows two pronounced peaks at the time lags around 70 and 140 ms. The topographies show the distribution of the cross-correlation values at the two peaks. Bottom panels show the p-values obtained when comparing the cross-correlation results with surrogate distributions in the time-frequency plane which show significant at all time-frequency points. (A) Cross-correlation values between the envelope of sound stimuli and EEG averaged across trials and subjects for the first session. (B) Cross-correlation values between the envelope of sound stimuli and EEG averaged across trials and subjects for the second session.

