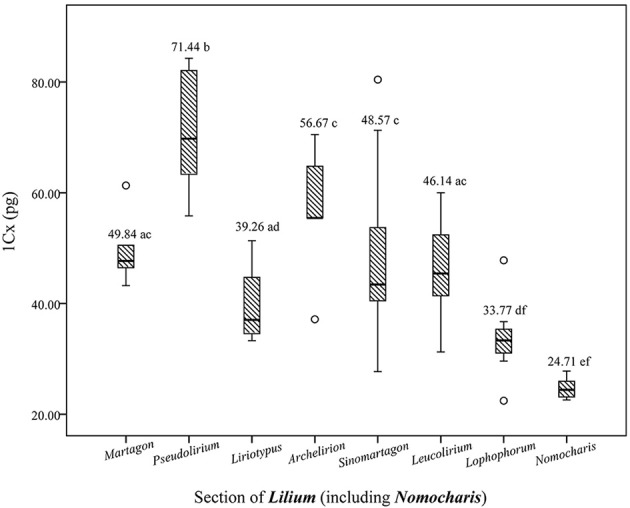
Figure 2.

Boxplots illustrating the variability of genome size of different sections of Lilium (including Nomocharis). The outlined central box depicts the middle 50% of the data extending from the upper to lower quartile; the horizontal bar is at the median. The ends of the vertical lines indicate the minimum and maximum data values, unless outliers are present. Circles indicate outliers. Values with different letters are significantly different.
