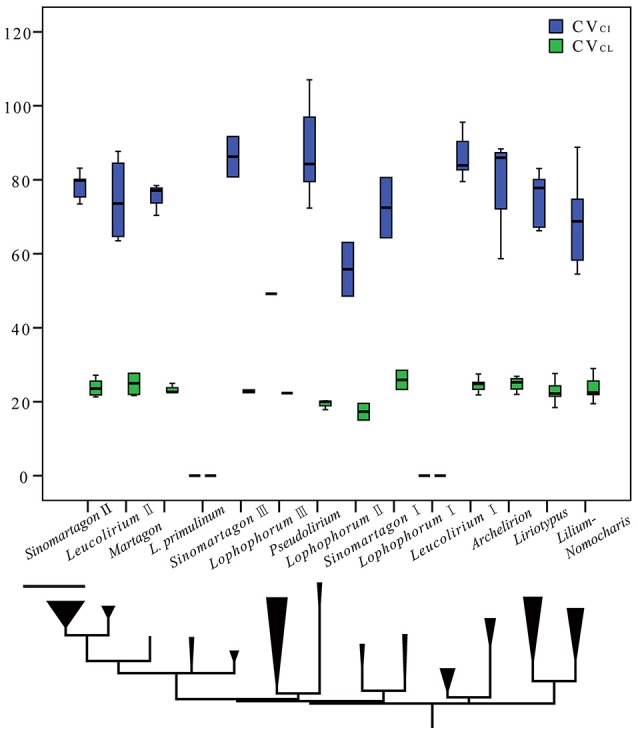
Figure 4.

Clustered boxplots illustrating the variability of both the coefficient of variation (CV) of the centromeric index (CVCI) and chromosome length (CVCL). The outlined central box depicts the middle 50% of the data extending from the upper to lower quartile; the horizontal bar is at the median. The ends of the vertical lines indicate the minimum and maximum data values, unless outliers are present. Circles indicate outliers. Taxa are ordered by phylogenetic grouping (according to the phylogenetic tree on the bottom of the graph, taken from Figure 1).
