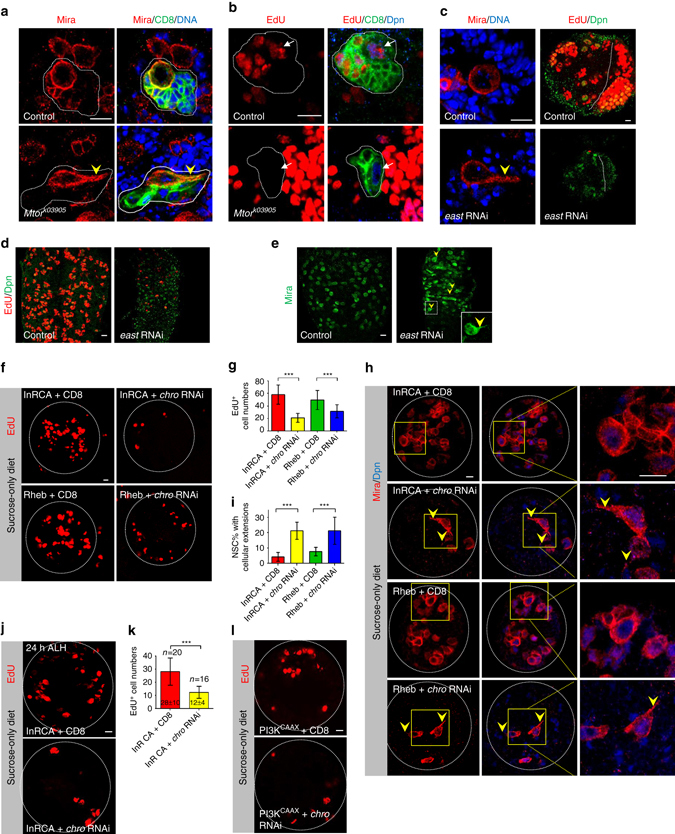
Fig. 2.

Spindle matrix proteins regulate NSC reactivation and function downstream of insulin pathway during NSC reactivation. a NSC MARCM clones in control and Mtor k03905 were labelled with Mira, CD8 and Topro-3 (for DNA). b EdU, CD8 and Dpn were labelled in control and Mtor k03905 NSC clones. c Mira and Topro-3 or Dpn and EdU were labeled in NSCs from control and east RNAi knockdown. d, e Dpn and EdU or Mira were labelled in the VNC of control and east RNAi knockdown. f Larval brains from overexpression of an active form of InR (OE InRCA) with UAS-CD8-GFP, overexpression of InRCA with chro RNAi knockdown (OE InRCA + chro RNAi), overexpression of RHEB (OE RHEB) with UAS-CD8-GFP, and overexpression of RHEB with chro RNAi knockdown (OE RHEB + chro RNAi) were raised on sucrose-only (amino-acid free) food for 72 h and labelled by EdU. g Quantification of EdU+ cells per brain hemisphere in various genotypes. h Mira and Dpn were labelled in OE InRCA with UAS-CD8-GFP, OE InRCA with chro RNAi, OE RHEB with UAS-CD8-GFP and OE RHEB with chro RNAi on sucrose-only food. The right panels are enlarged views of the yellow boxes in the left panels. i Quantification of NSCs with a cellular extension in various genotypes. j Larval brains from OE InRCA with UAS-CD8-GFP and OE InRCA + chro RNAi were raised on sucrose-only food for 24 h and labelled by EdU. k Quantification of EdU+ cells per brain hemisphere for j. l Larval brains from PI3K (PI3KCAAX) overexpression with UAS-CD8 or chro RNAi knockdown were raised on sucrose-only food for 72 h and labelled by EdU. All error bars indicate ± SD in g, i and k. *** indicates P < 0.001 in g, i and k by Student’s t-test. NSC clones were outlined by white dotted lines in a and b. Larval brain hemispheres were outlined by white dotted lines in f, h, j, l. Arrows indicated NSCs in b and arrowheads indicated the cellular extension of NSCs in a, c, e and h. Scale bars: 10 µm (a–c, f, h, j, l) and 20 µm (d, e)
