
Figure 1.
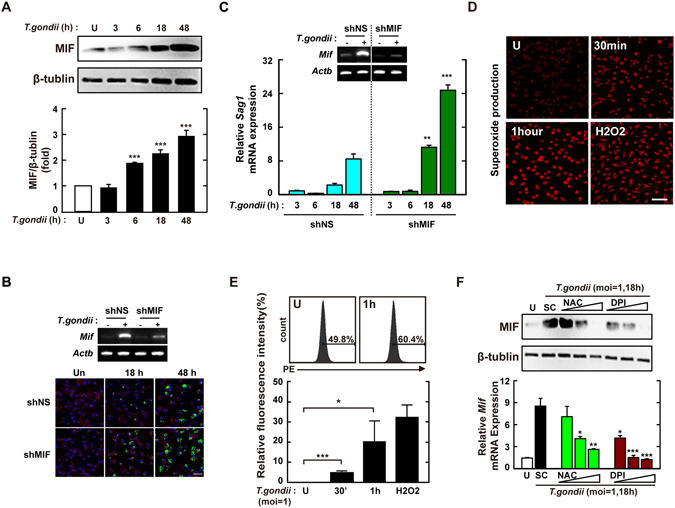
MIF expression via intracellular ROS generation is required for the inhibition of intracellular proliferation in T. gondii-infected macrophages. (A) BMDMs were infected with T.gondii RH strain (moi = 1) for the indicated time periods and then cell lysate was collected. Immunoblot analysis was performed for protein expression of MIF or β-tubulin. Upper panel, Representative gel image. Lower panel, Densitometry. (B,C) BMDM were transduced with lentiviruses expressing shNS or shMIF at a multiplicity of infection (MOI) of 5 for 48 h with polybrene (8 μg/mL) and then infected with GFP-RH strain (for B) or T. gondii RH strain (for C) for the indicated time periods. The mRNA expression for Mif and Actb was determined using semiquantitative RT-PCR (B) Cells were fixed and stained with Texas Red®-X phalloidin for labeling F-actin (red) for cytosolic fraction, and DAPI (blue) for nuclei and then analyzed for the number of GFP-RH strain using confocal microscopy (bottom) (C) Quantitative real-time PCR analysis were assessed to determine sag1 mRNA expression in whole-cell lysates. (D,E) BMDMs were infected with T. gondii RH strain (moi = 1) for indicated times and then stained with DHE (2 μM) for 15 min. Intracellular ROS generation was measured using confocal microscopy (for D) and flow cytometery (for E). Scale bar = 50 μm. H2O2 (1 mM, 30 min) was used for positive control. (F) Immunoblot (top) or qPCR (bottom) analysis of MIF expression in BMDMs after T. gondii RH strain infection (moi = 1, 18 hr) in the presence or absence of general antioxidant (NAC; 1, 2, or 5 mM) or Nox inhibitor (DPI; 1, 5, or 10 μM). Data are representative of three independent experiments and are presented as means ± SD. *P < 0.05, **P < 0.01, ***P < 0.001, two-tailed Student’s t-test.