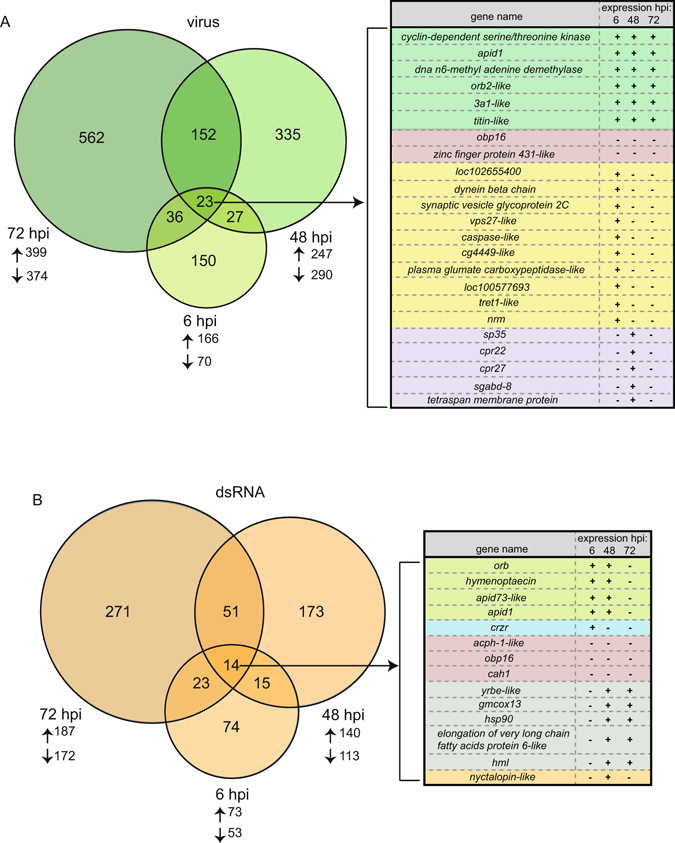
Figure 3.

Honey bee transcriptional response to virus-infection and dsRNA-treatment is time-dependent. (A) There were hundreds of differentially expressed genes (DEGs) in virus-infected bees, as compared to mock-infected bees. Venn diagram analysis identified shared and unique DEGs of virus-infected bees 6, 48, and 72 hours post-infection (hpi). Twenty-three genes were differentially expressed at all three time points post-infection. Six of these genes consistently exhibited increased expression (highlighted in green and listed from highest average log2 fold change to lowest) and two genes consistently exhibited decreased expression (red). Ten genes exhibited increased expression at 6 hpi and decreased expression at 48 and 72 hpi (yellow). Five genes (purple) displayed increased expression at 48 hpi, but decreased expression at 6 and 72 hpi. Arrows pointing up denote number of genes that exhibited increased expression for each time point and arrows pointing down denote number of genes that exhibited decreased expression. (B) There were hundreds of differentially expressed genes (DEGs) in dsRNA-treated bees compared to mock-infected bees. Venn diagram analysis identified shared and unique DEGs of dsRNA-treated bees at 6, 48, and 72 hpi, including 14 genes that were differentially expressed at all time points. There were four genes (green) that exhibited increased expression at 6 and 48 hpi and decreased expression at 72 hpi, three of which are antimicrobial peptides (AMPs). One gene, crzr, exhibited increased expression at 6 hpi, but decreased expression in bees 48 and 72 hpi (blue). Three genes displayed consistently decreased expression (red). Five genes had decreased expression at 6 hpi and increased expression at 48 and 72 hpi (gray), including heat shock protein 90. One gene, nyctalopin-like, exhibited decreased expression in bees 6 and 72 hpi, but increased expression in bees 48 hpi (orange). DEGs with Benjamini-Hochberg corrected q-values ≤ 0.05 were included in Venn diagram analyses. Full lists of DEGs and their fold changes from all contrasts in each Venn diagram are provided in Supplementary Tables S7 and S8.
