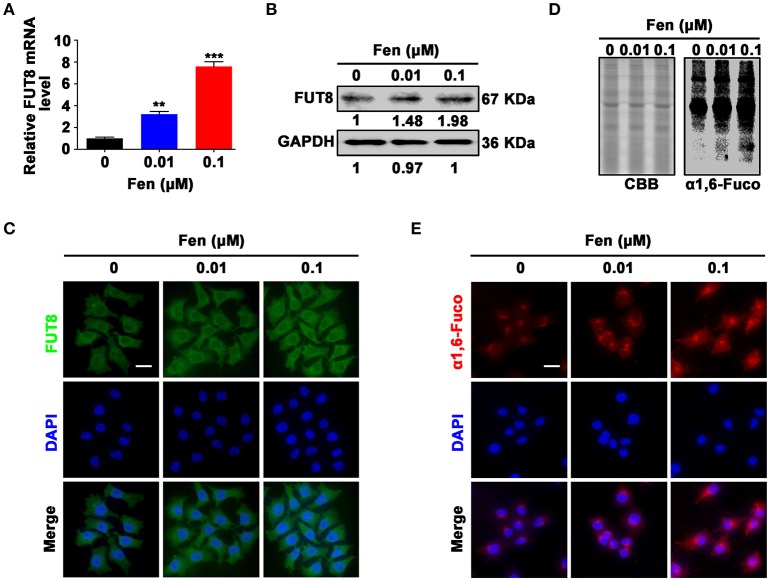
Figure 3.
Fentanyl upregulates FUT8 expression and α1, 6-fucosylation level in MCF-7 cells. (A) qPCR analysis of FUT8 gene expression. (B) Western blot analysis of FUT8 protein expression. (C) Representative immunofluorescent images of FUT8 expression. (D) Lectin blot analysis of α1, 6-fucosylation level. Coomassie brilliant blue (CBB) was used as a loading control. (E) Lectin fluorescent staining of α1, 6-fucosylation expression. (Scale bars = 50 μm; Magnification, 400×). Data are represented as mean ± SD (n = 3). Statistical significant different in gene expression (**P < 0.01; ***P < 0.001).

