Figure 2.

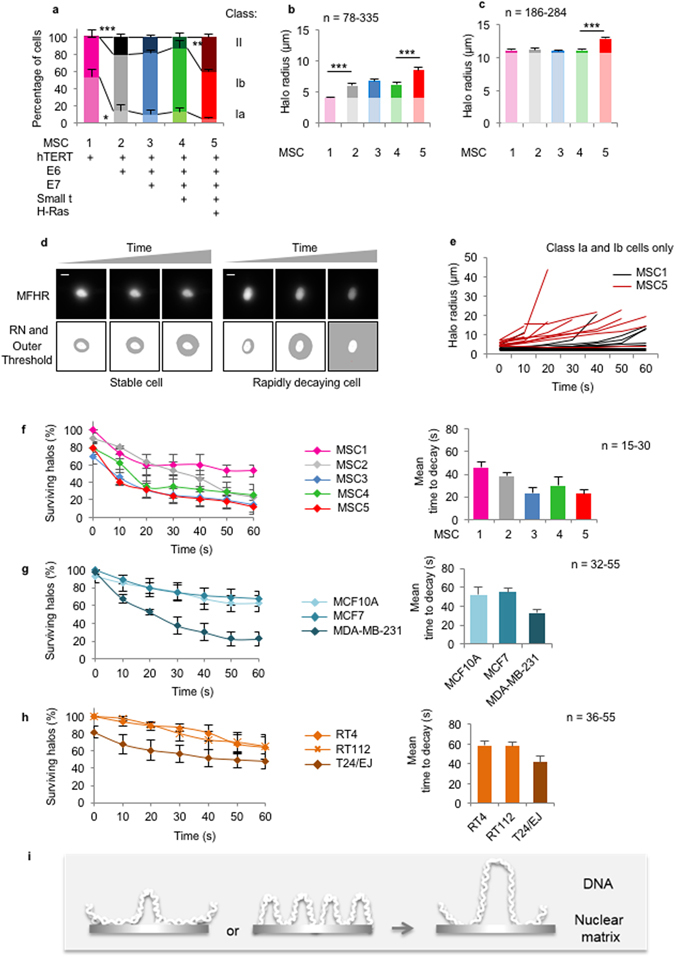
Transformation-induced changes in chromatin loop size and stability. (a) Class distribution for Mesenchymal Stem Cell (MSC) series, with introduction of the indicated oncogenes14. (b) Mean halo radius using HIM x75/x180 or (c) HIM x75/15. (d) Example MFHR stability over time, showing edges determined by HIM x75/x180. (e) Halo measurements over 60 s time-course for individual MSC1 and MSC5 cells. (f) Stability measurements plotted as percentage of surviving halos (left), and average time to decay (right). (g) and (h), as in f, for breast and bladder-derived cell lines respectively. (i) Possible effects of transformation on DNA:NM interface.
