
Fig. 1.
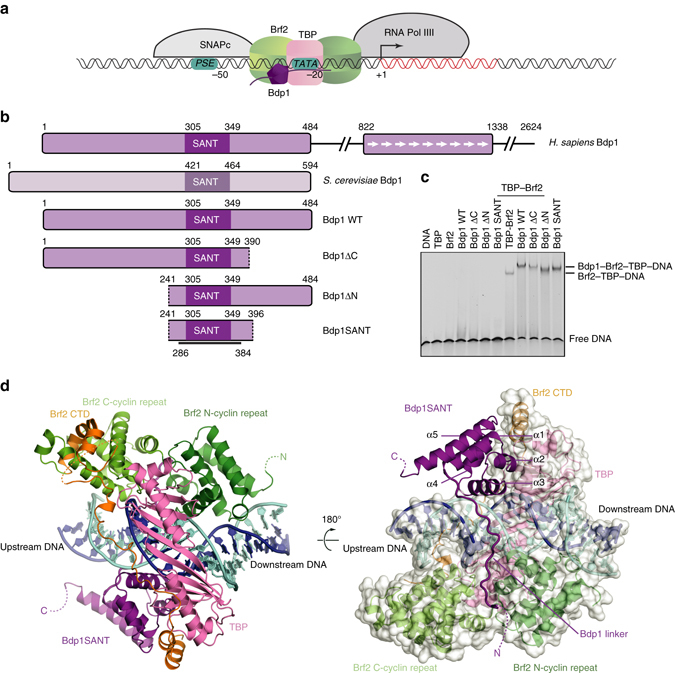
Structure of the Brf2–TBP–Bdp1–DNA complex. a Architecture of a RNA Pol III type III promoter. Numbers indicate the position of promoter elements relative to the transcriptional start site (+1). b Schematic overview of Bdp1 proteins and variants used in this study. The black line represents the region for which an atomic model could be built in the electron density. c EMSA showing binding of different Bdp1 constructs to Brf2–TBP–DNA complexes (last four lanes). d Two views of the Brf2–TBP–Bdp1–DNA complex. The template and non-template DNA strands are depicted in blue and cyan, respectively