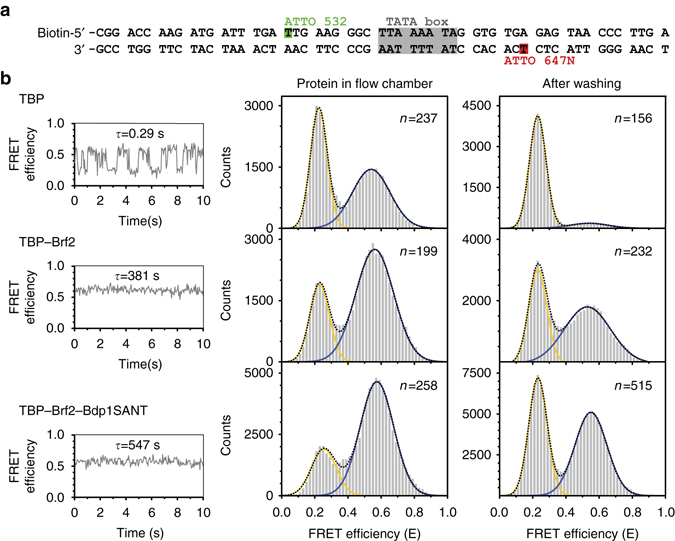
Fig. 5.

Influence of transcription factors on promoter DNA conformation. a Single-molecule FRET measurements were carried out using a synthetic U6 snRNA promoter. FRET between an internal donor (ATTO 532) and acceptor (ATTO 647 N) dye was used as a readout to follow transcription initiation factor-induced bending of the promoter DNA. b Measurements on immobilized molecules were conducted once with the proteins present in the flow chamber and after a washing step that removed freely diffusing proteins. A representative intensity–time trace for each measurement is shown depicting the dynamic association and dissociation of TBP (10 nM) with and from the DNA with a complex lifetime of τ = 0.29 s. In contrast, addition of Brf2 results in a stable complex characterized by a single high FRET state with a complex lifetime of 381 s. Addition of Bdp1SANT increased the lifetime of the high FRET state to 547 s. FRET efficiency histograms show the distribution between low FRET (free DNA) and high FRET states (bend DNA). The total number of molecules used for each histogram is given as n. Each histogram was fitted with a single or double Gaussian distribution to determine the mean FRET efficiencies (see Table 2). Each measurement was carried out at least three times
