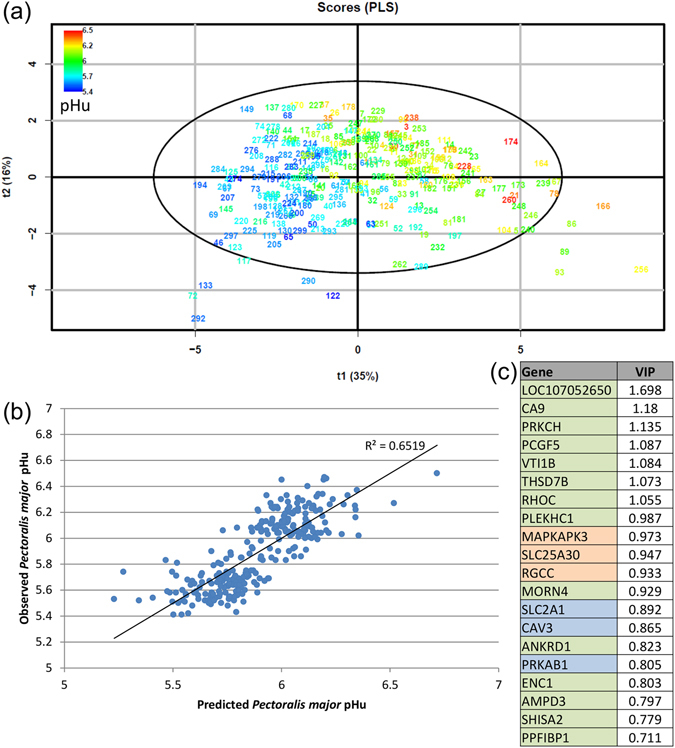
Figure 5.

Final PLS model for the pectoralis major pHu prediction. The final PLS model was fitted on the mRNA expression of 20 genes (measured using RT-qPCR microfluidic technology) on a population of 278 male and female individuals from the pHu+ and pHu− lines in order to predict the pectoralis major pHu. (a) Score plot of the two first components (t1, t2) from the PLS model. Points correspond to chicken tags coloured according to their measured pHu value in the pectoralis major muscle. The cumulative explanatory and predictive performance characteristics of the model are R2(cum) = 0.65 and Q2(cum) = 0.62. The root mean square error of the estimation (RMSEE) was 0.16. (b) Scatterplot of the observed pHu vs. predicted pHu. (c) Variable Importance in Projection (VIP) of each variable (genes) in the final PLS model (the genes from the fsPLS model are highlighted in green, those with an extreme FC based on microarray analysis are in orange, and those whose function is directly related to carbohydrate and muscle metabolism are in blue).
