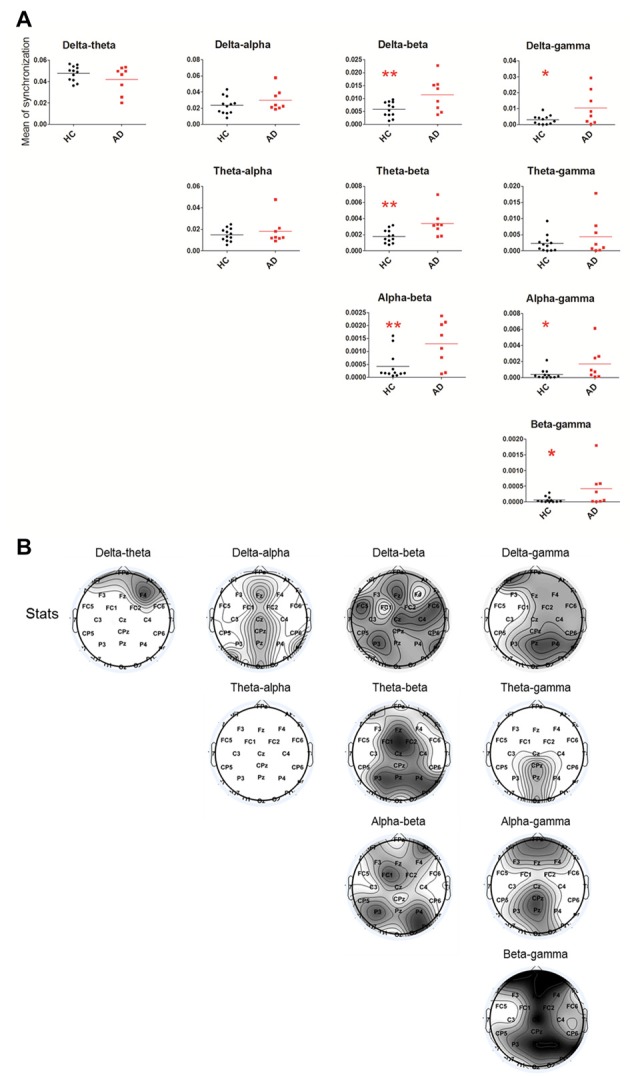
Figure 2.

Statistical analysis of filtered wavelet bicoherence value (FIWBIC) in the AD group compared with the HC group and topgraphic distribution of statistical differences. (A) Scatter plot for phase coupling at local frequency bands in the HC group (black) and AD group (red).The Y-axis represented the mean of synchronization. The synchronization values increased between between beta and delta/theta/alpha, and between gamma and delta/alpha/beta. *PFDR < 0.05, **PFDR < 0.01, (n = 8–12). (B) Topographic distribution of statistical significances in cross-frequency coupling between two groups. Values were color coded. Black: P < 0.001; dark gray: P < 0.01; light gray: P < 0.05; white: not significant, uncorrected for the number of electrodes tested.
