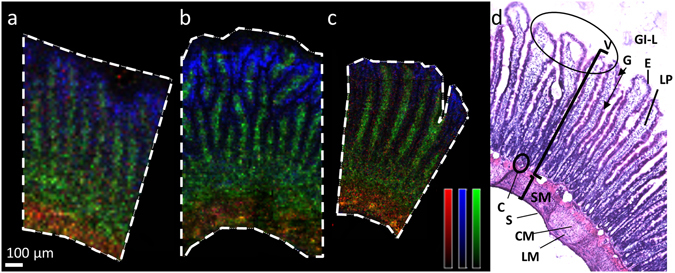
Figure 1.

Ion distribution images of three different endogenous compounds. (a–c) MALDI MSI ion distribution images of three different endogenous compounds (m/z 772 (green), m/z 769 (red) m/z 804 (blue)) representing different anatomical structures of the intestine lamina propria, submucosa, and epithelial cell layer, respectively. Data was acquired at three different spatial resolutions on three different tissue sections from intestine (a) 15 µm, (b) 10 µm, and (c) 5 µm. The ion intensities are displayed on monochrome colour scales where red is scaled to 50% of max intensity, blue is scaled to 25% of max intensity, and green is scaled to 60% of max intensity. Scale bar 100 µm. (d) H&E stained image of fresh frozen rat intestine processed in same way as sections for MSI analysis with annotated regions of the intestine. GI-L = gastrointestinal lumen; V = villi, oval circle villus tips; SM = submucosa; E = epithelial enterocytes (dark eosinophilic stain); G = goblet cell (arrow tip, not stained in H&E); LP = lamina propria; C = crypt base; S = serosa; LM = longitudinal muscle; CM = circular muscle.
