Figure 3.

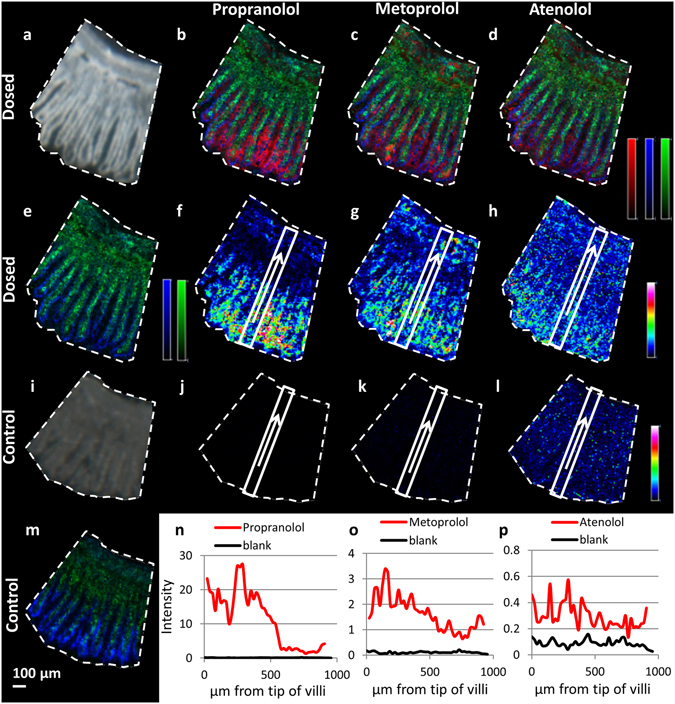
Distribution profiles of the three selected drugs in rat small intestine following oral dosing. (a) Scanned photo of tissue 30 cm distal from the pyloro-duodenal junction, collected 20 min post administration (10 µmol/kg). (b–d) Ion distribution image of drug (red) together with two endogenous compounds used as villi markers (green m/z 772.6, blue m/z 804.6); (b) propranolol (m/z 260), (c) metoprolol (m/z 268), (d) atenolol (m/z 267). (e) Ion distribution image of two villi markers (green m/z 772.6, blue m/z 804.6) on dosed tissue. (f–h) Ion distribution image of drug represented by a rainbow colour. The rectangle areas and arrows from villi tips to submucosa mark the area from which the compound abundance is transformed into the line graphs in panels n–p. (f) Propranolol (m/z 260), respective line graph red line in panel n. (g) metoprolol (m/z 268), respective line graph red line in panel o. (h) atenolol (m/z 267) respective line graph red line in panel p. (i) Scanned photo of control tissue, not dosed with compound. (j–l) Ion distribution images of compounds propranolol (j, m/z 260), metoprolol (k, m/z 268), atenolol (l, m/z 267) with rectangles indicating the area from which the intensity was derived to produce line graphs (blanks in panels n-p respectively). (m) Ion distribution image two villi markers (green m/z 772.6, blue m/z 804.6) on control tissue. (n–p) line graphs of compound exposure along the crypt-villus axis in dosed (red) and non-dosed (black) tissue, (n) propranolol, (o) metoprolol, p) atenolol. The intensity levels are extracted as average intensity from the tip towards the base of the villi, from the area marked with rectangles in panels f–h (dosed) and (j–l) (control). (b–e,m) are represented by monochrome colour scales; red - scaled to 60% of max intensity, green - scaled to 40% of max intensity, blue - scaled to 30% of max intensity. (f–h and j–l) are represented by a rainbow colour scaled to 60% of max intensity for each individual m/z. Images were acquired at 10 µm spatial resolution. Scale bar 100 µm.
