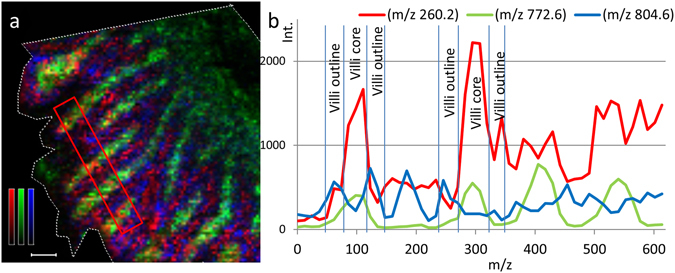
Figure 4.

Ion distribution image and transverse profile of propranolol in rat small intestine villi following oral administration. (a) Ion distribution images of propranolol (m/z 260.2) together with two different villi markers; m/z 772.6 represents lamina propria region and m/z 804.6 represents the zone of the epithelial cells of the villi outline. Propranolol is represented by a red monochrome colour scale; scaled to 10% of max intensity, m/z 772.6 is represented in green; scaled to 60% of max intensity, and m/z 804.6 is represented in blue; scaled to 20% of max intensity. Scale bar is 100 µm. (b) The intensities of propranolol (red), m/z 772.6 (green), and m/z 804.6 (blue) are also represented by line graphs.
