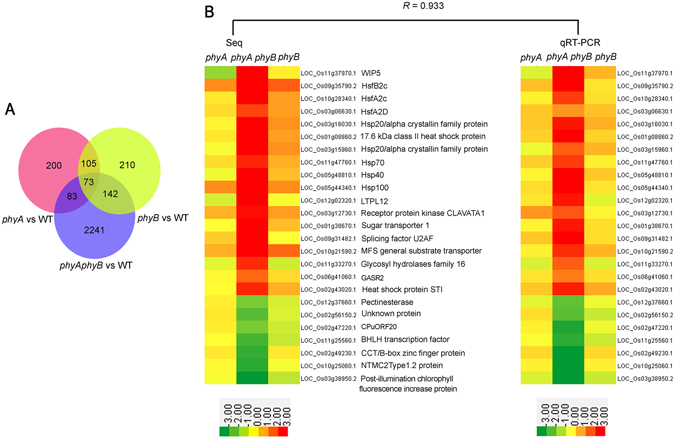
Figure 5.

Comparison and validation of transcript profiles of anthers in phyA and phyB single and double mutants, and wild-type (WT) rice. (A) Distribution of differentially expressed genes in anthers among phyA and phyB single and double mutants, and WT. (B) Validation of RNA sequencing results by quantitative reverse transcription PCR. Transcript abundances represented by the two heat maps are the log2-transformed averages of RPKM values of the RNA sequencing analysis (left) from three biological replicates and transcript abundance values from three independent quantitative reverse transcription PCR experiments (right). The heat maps were drawn using Cluster 3.0. Relative expressions are indicated by the color scales at the bottom of the figure. R is the correlation coefficient value between the two platforms.
