
Figure 4.
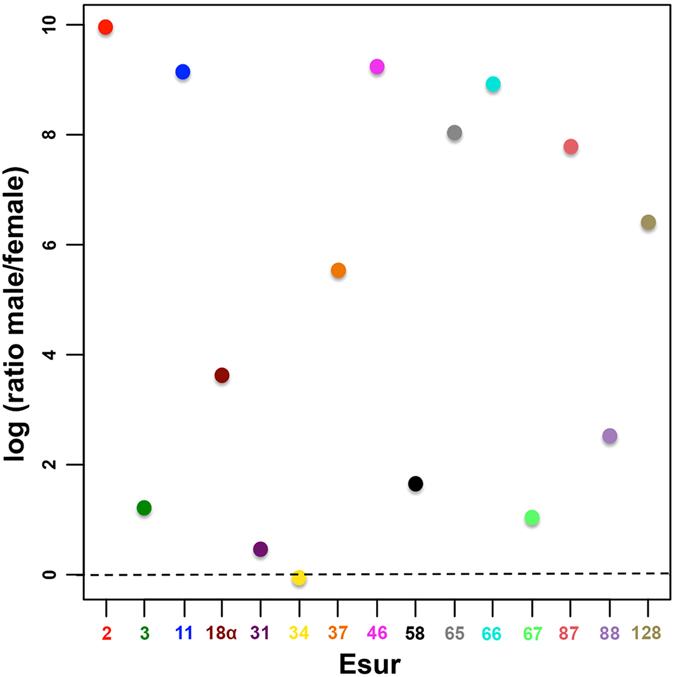
Copy number variation between male vs female genomes of 15 satDNAs with monomers >60 bp in E. surinamensis. The male/female ratio of a relative copy number is shown on a logarithmic scale. The qPCR of male and female genomic DNA was used to calculate the satDNA dose by a ΔCt method of relative quantification (see Supplementary Table S3). Each satDNA family (Esur) is represented by numbers and colors directly in the images. Note that most satDNAs differ significantly between sexes with males having a higher copy number than females for most repeats studied. The statistical significance for difference in copy number between males and females using chi-squared test was highly significant, p-value < 0.01 for each satDNA.